Pólya Plots
Initializing live version


Requires a Wolfram Notebook System
Interact on desktop, mobile and cloud with the free Wolfram Player or other Wolfram Language products.
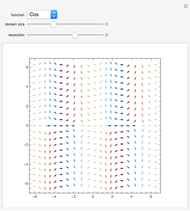
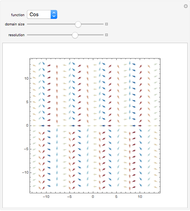
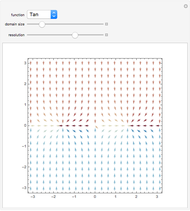
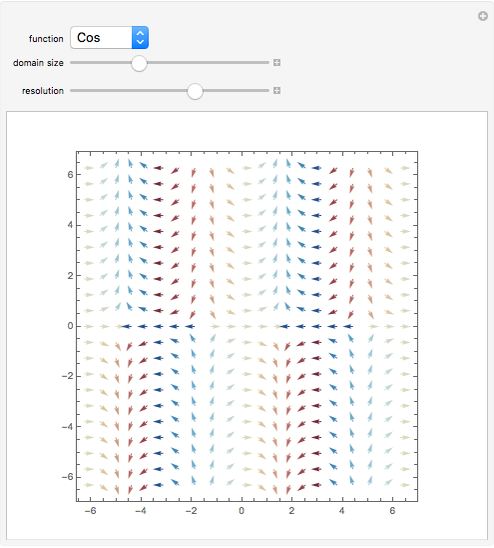
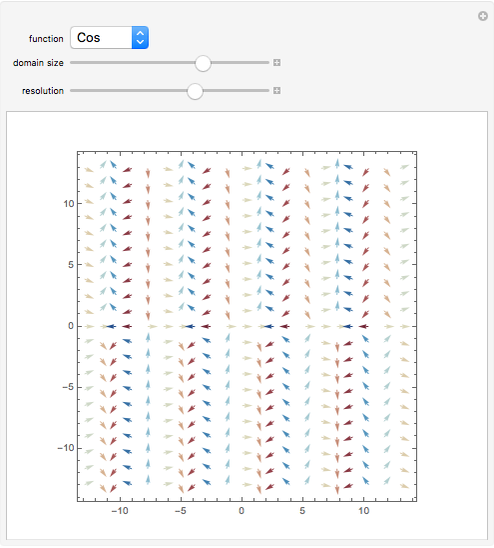
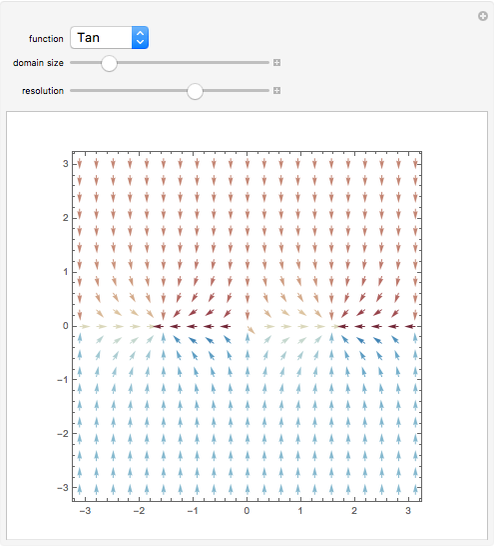
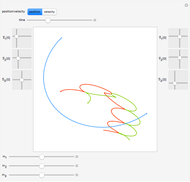
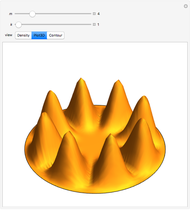
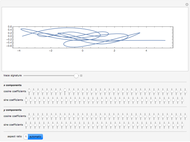
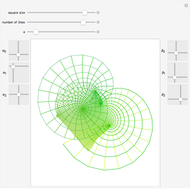
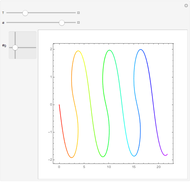
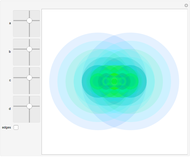
This demonstrates a Pólya plot of trigonometric and inverse trigonometric functions. Pólya plots show the 'flow' of complex‐valued functions in the complex plane. Choose a function of interest and then explore its behavior in the complex plane by varying the domain and resolution.
Contributed by: Michael Trott (March 2011)
Open content licensed under CC BY-NC-SA
Snapshots
Details
function — the trigonometric or inverse trigonometric function to be used domain size — extension of the domain in which to plot the function resolution — the number of arrows per dimension
Permanent Citation
Related Demonstrations
More by Author
 Complex Power Plot
Sue Hurley Visualizing the Gradient Vector
Eric Schulz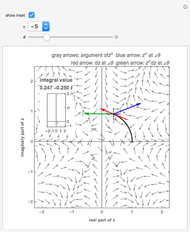 The Geometry of Integrating a Power around the Origin
John Custy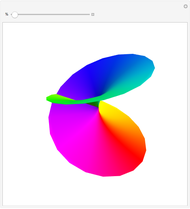 Riemann Surface Transition
Michael Trott Slope Fields
Charles E. Oelsner Line Plots, Histograms, and Stem-and-Leaf Plots
Sarah Lichtblau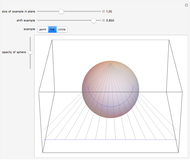 Stereographic Projection
Michael Schreiber Rotating by Powers of i
Michael Schreiber Euler's Identity
Jim Kaiser The Argument Principle
Andrzej Kozlowski
-
 Planar Three-Body Problem in Phase Space
Michael Trott -
 Planar Three-Body Problem
Michael Trott -
 Band Spectrum in a Periodic Potential
Michael Trott -
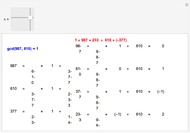
 The Euclidean Algorithm and Simple Continued Fractions
Michael Trott -
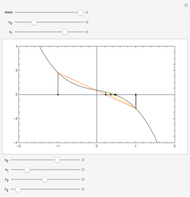 Secant Root Finding Method
Michael Trott -
 Particle in an Infinite Circular Well
Michael Trott -
 The Powers Of Presidents and Prime Ministers
Michael Trott -
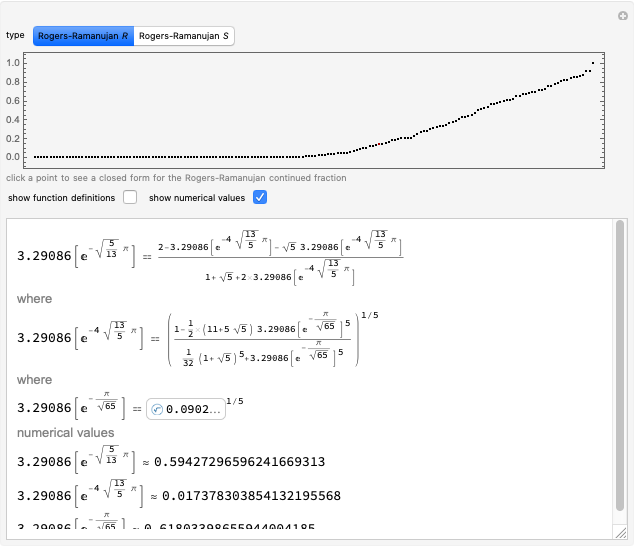 Ramanujan R and S
Michael Trott -
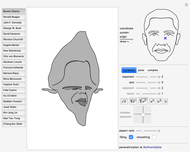
 Jack Lew Signature Function
Michael Trott -
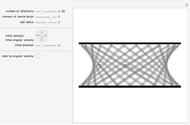
 Reflections in an Elliptical Region
Michael Trott -
 Orbit of a Test Charge in the Field of a Charged Ring
Michael Trott -
 Mean Value Theorem
Michael Trott -
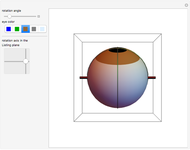 Listing's Law
Michael Trott -
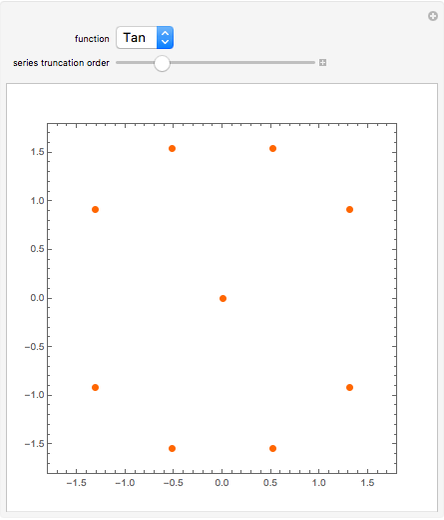 Zeros of Truncated Series of Elementary Functions
Michael Trott -
 Extended Euclidean Algorithm
Michael Trott -
 Multiple Reflections of a Superball
Michael Trott -
 Conformal Maps
Michael Trott -
 Complex Pendulum Oscillations at Complex Times
Michael Trott -
 Commute p to the Left
Michael Trott -
 Circle Reflections
Michael Trott