Pressure-Temperature Phase Diagram for Water

Requires a Wolfram Notebook System
Interact on desktop, mobile and cloud with the free Wolfram Player or other Wolfram Language products.
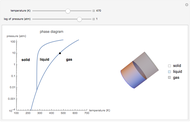
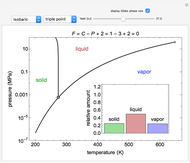
Phase behavior for water is represented on a log pressure versus temperature diagram. Use the first drop-down menu to select for either an isothermal or isobaric process. Select the particular phase transition (sublimation, melting, vaporization, triple point) from the second drop-down menu. For isobaric transitions, you can add heat with the slider. For isothermal transitions, the specific volume is changed. The relative amounts of each phase present are shown in the bar graph. A log pressure-temperature graph with an expanded temperature scale is inserted for isothermal melting because of the steepness of the phase transition line. At the triple point, the three phases are present simultaneously. Select "display Gibbs phase rule" to show the phase rule applied at the location of the black dot.
Contributed by: Neil C. Hendren (December 2017)
Additional contributions by: John L. Falconer and Rachael L. Baumann
(University of Colorado Boulder, Department of Chemical and Biological Engineering)
Open content licensed under CC BY-NC-SA
Details
The Gibbs phase rule, which determines how many intensive variables (e.g., temperature, pressure) can be varied independently, is:
 ,
,
where  is the number of degrees of freedom,
  is the number of components and
  is the number of phases.
In a single-phase region, heat may be added isobarically to increase the temperature:
 ,
,
where  is the amount of heat added,
  (kJ/kmol K) is the constant-pressure heat capacity,
  is the number of moles, and
  and
and  (K) are the initial and final temperatures. For isothermal processes, changes in the specific volume (L/mol) accompany phase changes; heat must be added or removed for these phase changes to take place.
In a two-phase region, the amount of each phase can be determined from:
 ,
,
where  (mol) is the amount of the higher-energy phase,
  (mol) is the amount of the lower-energy phase,
  (kJ/mol) is the specific enthalpy of the system,
  (kJ/mol) is the specific enthalpy of the saturated high-energy phase and
  (kJ/mol) is the specific enthalpy of the saturated low-energy phase. Note that
  ,
,  and
and  must be evaluated at the same temperature and pressure.
Within the triple point, the amounts of each phase composition is complex [1, 2].
References
[2] Revised Release on the IAPWS Industrial Formulation 1997 for the Thermodynamic Properties of Water and Steam, Report Number IAPWS R7-97(2012), Lucerne, Switzerland: The International Association for the Properties of Water and Steam. (Aug 3, 2018) www.iapws.org/relguide/IF97-Rev.html.
[3] J. R. Elliott and C. T. Lira, Introductory Chemical Engineering Thermodynamics, 2nd ed., Upper Saddle River, NJ: Prentice Hall, 2012.
Snapshots
Permanent Citation


