Temperature-Composition Diagram for Immiscible Liquids

Requires a Wolfram Notebook System
Interact on desktop, mobile and cloud with the free Wolfram Player or other Wolfram Language products.
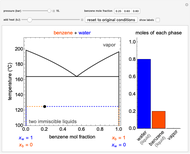
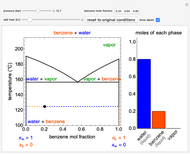
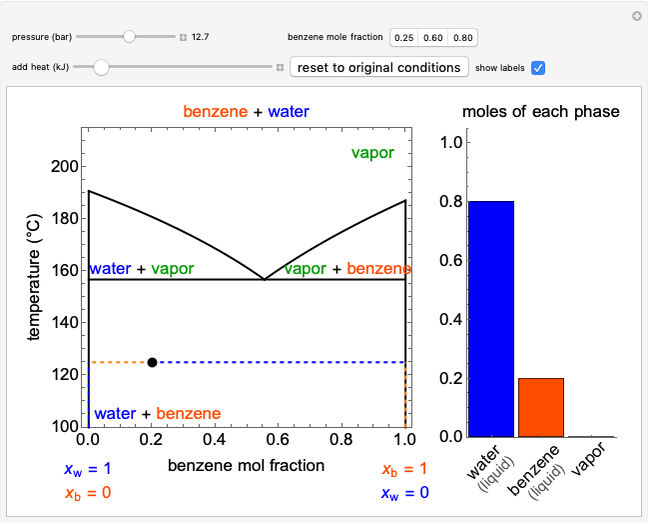
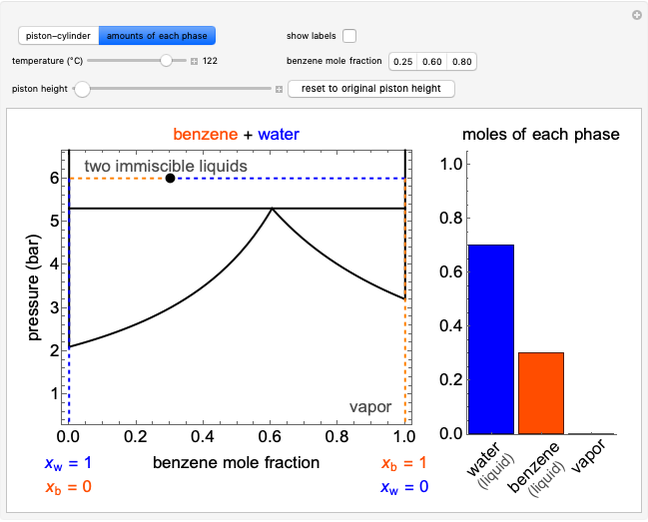
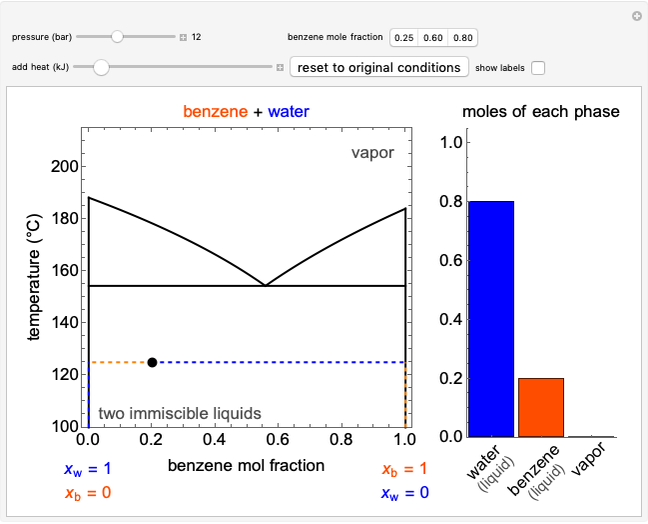
The temperature-composition phase diagram for two immiscible liquids, benzene and water, is at constant pressure. Set the pressure with a slider to change the saturation temperature. Set the overall benzene mole fraction with its slider. The bar graph shows the moles of liquid water (blue), liquid benzene (orange) and vapor (green), which contain both components. The system contains one mole total. You can add heat to change the temperature and the amounts in each phase. At a given pressure, all three phases co-exist at only one temperature. When heat is added at this temperature, one of the liquid phases completely evaporates before the temperature increases.
Contributed by: Rachael L. Baumann (April 2015)
Additional contributions by: John L. Falconer, Derek M. Machalek, and Garrison J. Vigil
(University of Colorado Boulder, Department of Chemical and Biological Engineering)
Open content licensed under CC BY-NC-SA
Snapshots


Details
The pressure  of the vapor above two immiscible liquids, benzene and water, is the sum of the individual saturation pressures
  (benzene) and
  (water):
 ,
,
The Antoine equation is used to calculate the saturation pressures:
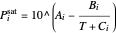 ,
,
where  ,
,  , and
, and  are Antoine constants for component
  , and
, and  is temperature (°C).
The dew point curves for the two liquids can be found by solving the following equations for temperature.
For conditions where liquid water is present:
 ,
,
and for conditions where liquid benzene is present:
 ,
,
where  and
and  are the vapor mole fractions for benzene and water.
The screencast video at [1] explains how to use this Demonstration.
Reference
[1] Temperature-Composition Diagram for Immiscible Liquids. www.colorado.edu/learncheme/thermodynamics/TxyImmiscibleLiquids.html.
Permanent Citation
 Immiscible Liquids on Pressure-Composition Diagram
Rachael L. Baumann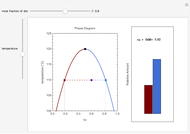 Lever Rule Applied to Phase Diagram for Partially Miscible Liquids
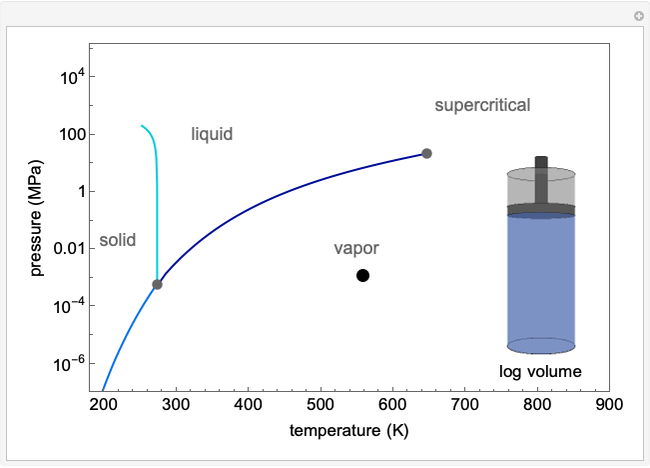
Lisa M. Goss Pressure-Temperature Phase Diagram for Water
Neil C. Hendren Partially Miscible Liquids
Rachael L. Baumann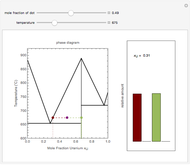 Lever Rule for the Uranium-Titanium Solid-Liquid Phase Diagram
Lisa M. Goss Pressure-Volume Diagram for a Vapor-Liquid Mixture
Adam J. Johnston and Rachael L. Baumann Vapor-Liquid Equilibrium Diagram for Non-Ideal Mixture
Rachael L. Baumann Liquid-Liquid Extraction (LLE) on a Right-Triangle Ternary Phase Diagram
Rachael L. Baumann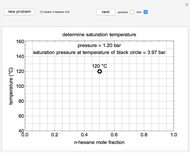 Construct a T-x-y Diagram for Vapor-Liquid Equilibrium (VLE)
Rachael L. Baumann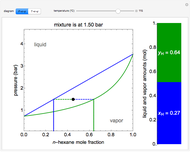 P-x-y and T-x-y Diagrams for Vapor-Liquid Equilibrium (VLE)
Rachael L. Baumann
-
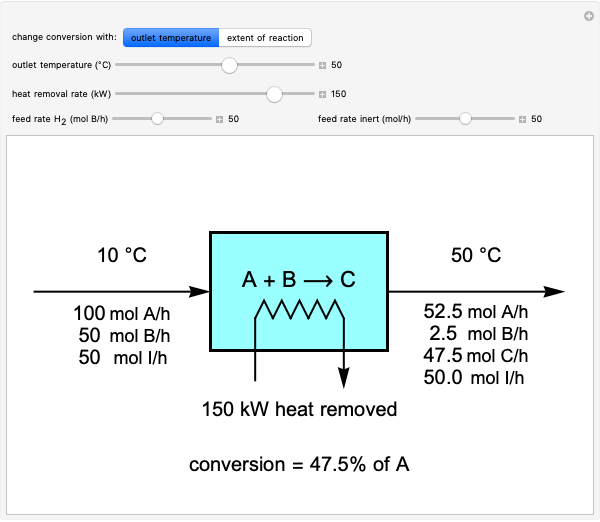 Material and Energy Balances in a Reactor with Heat Exchange
Rachael L. Baumann -
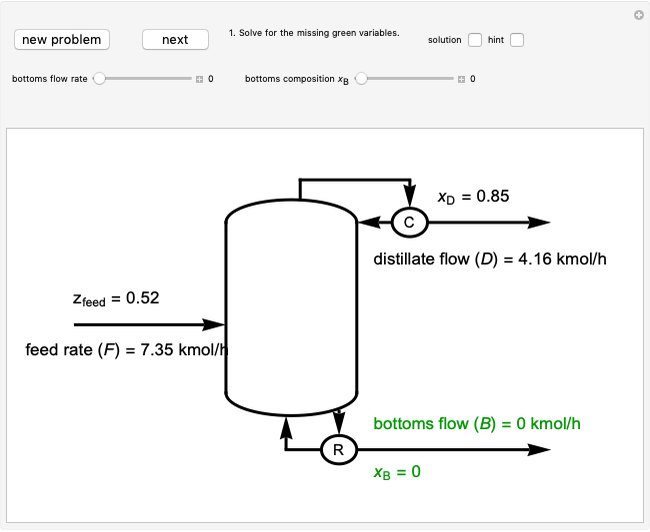 Construct a McCabe-Thiele Diagram for Distillation
Rachael L. Baumann -
 Reversible and Irreversible Expansion or Compression Work
Rachael L. Baumann -
 Construct an x-y Diagram for a Stripping Column
Rachael L. Baumann -
 Temperature-Composition Diagram for Immiscible Liquids
Rachael L. Baumann -
Immiscible Liquids on Pressure-Composition Diagram
Rachael L. Baumann -
 Construct an x-y Diagram for an Absorption Column
Rachael L. Baumann -
 Stripping Column Operation
Rachael L. Baumann -
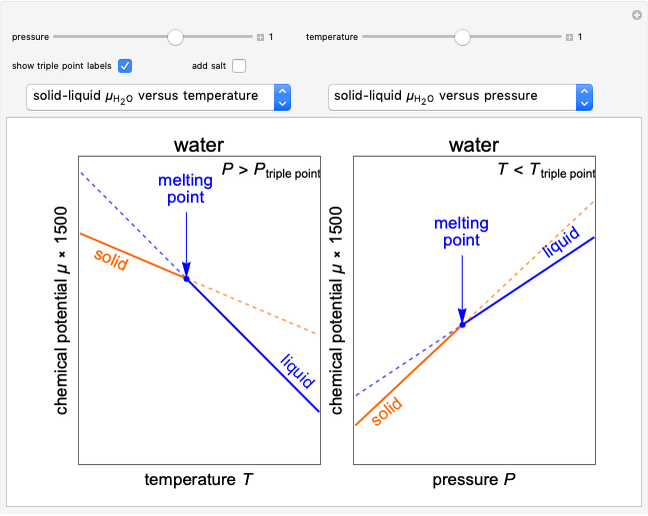 Chemical Potential Dependence on Temperature and Pressure
Rachael L. Baumann -
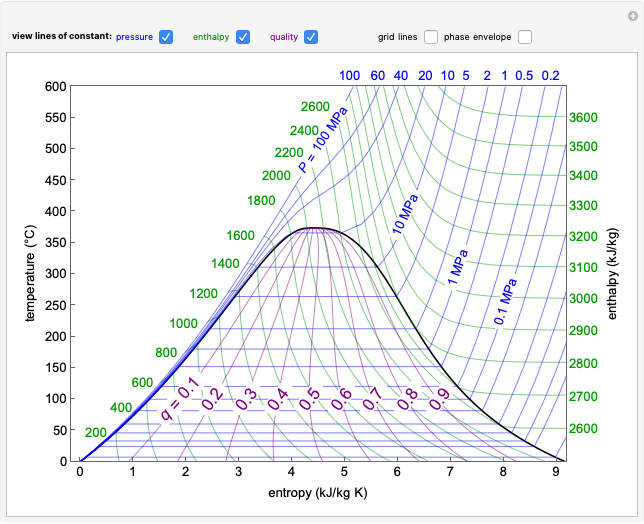 Temperature-Entropy Diagram for Water
Rachael L. Baumann -
 Adding a Second Component to a Fixed-Volume Container
Rachael L. Baumann -
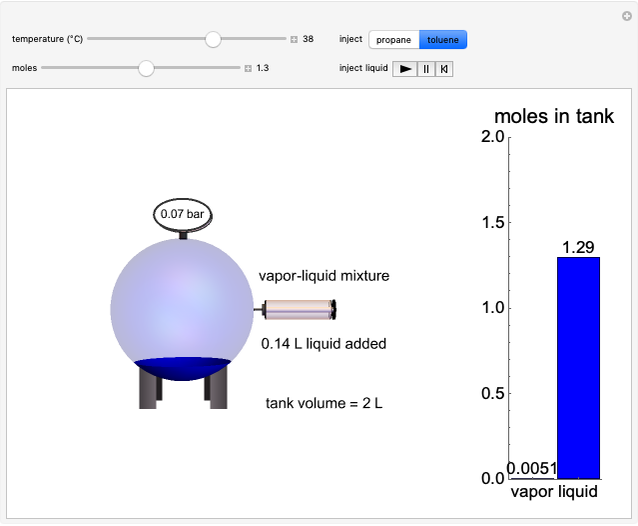 Injecting a Liquid into an Evacuated Tank
Rachael L. Baumann -
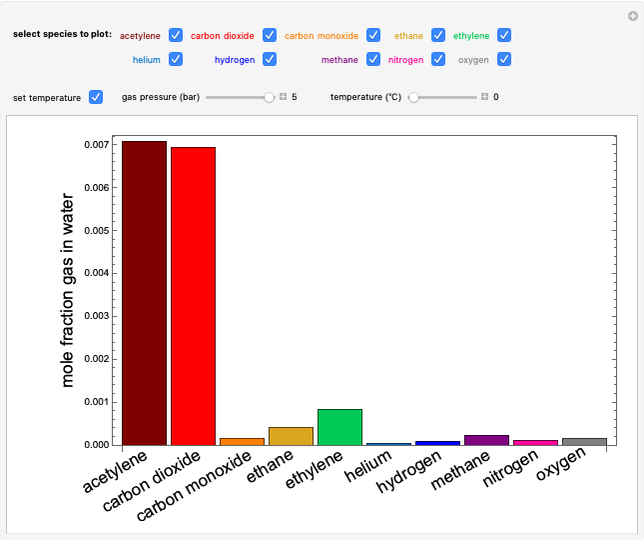 Henry's Law for Gases Dissolved in Water
Rachael L. Baumann -
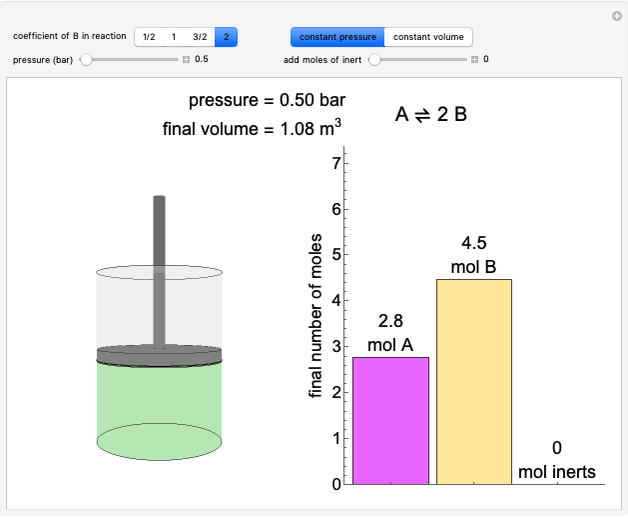 Gas-Phase Chemical Equilibrium at Constant Pressure or Constant Volume
Rachael L. Baumann -
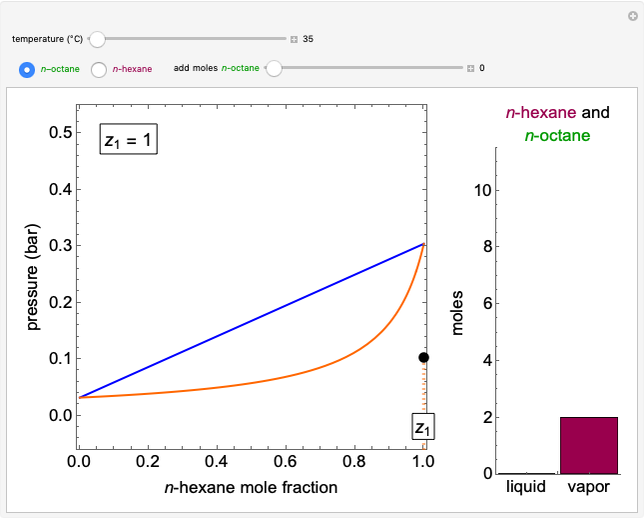
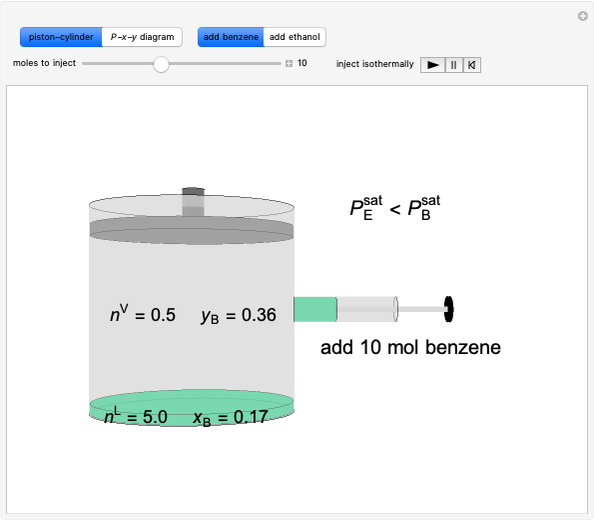
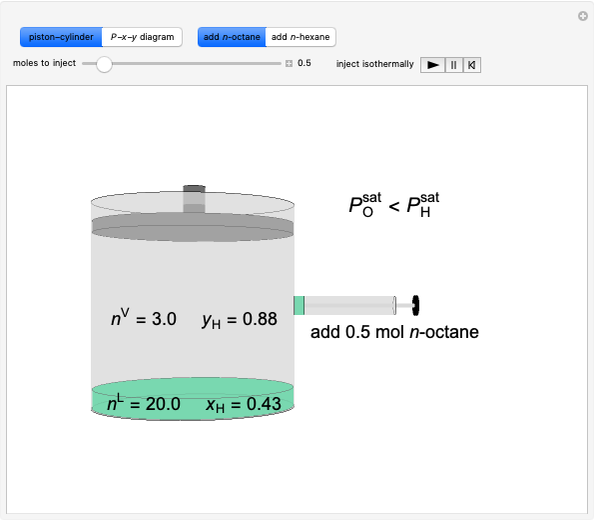 Adding One Component to a Binary Vapor-Liquid Equilibrium (VLE) Mixture
Rachael L. Baumann -
 Add a Component to a Mixture with an Azeotrope
Rachael L. Baumann -
 Circumnavigating the Critical Point
Rachael L. Baumann -
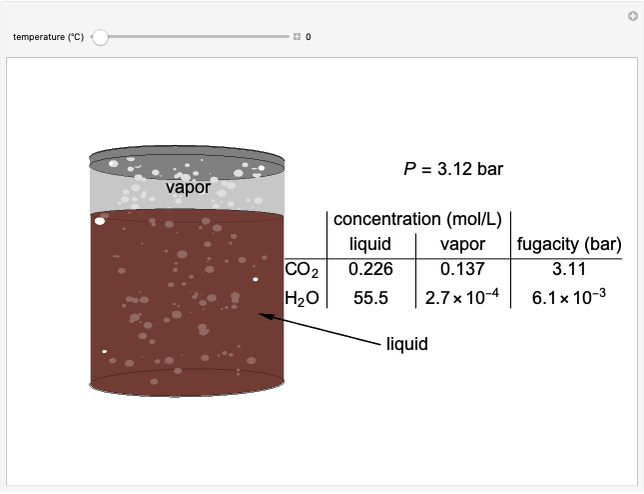 Fugacities in a Can of Soda
Rachael L. Baumann -
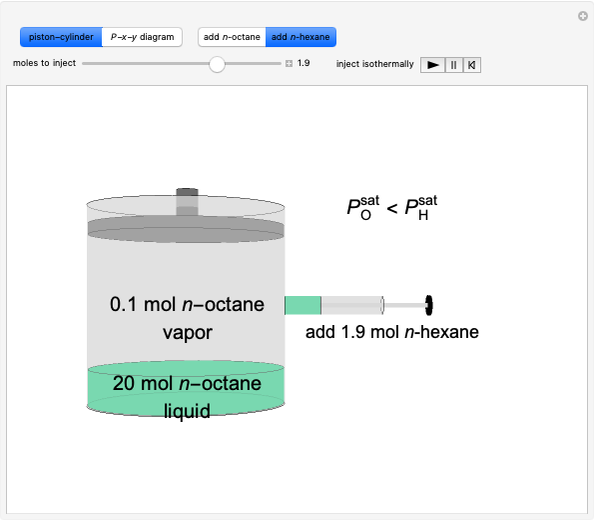 Adding a Second Component to a Single-Component Vapor-Liquid Equilibrium (VLE) Mixture
Rachael L. Baumann -
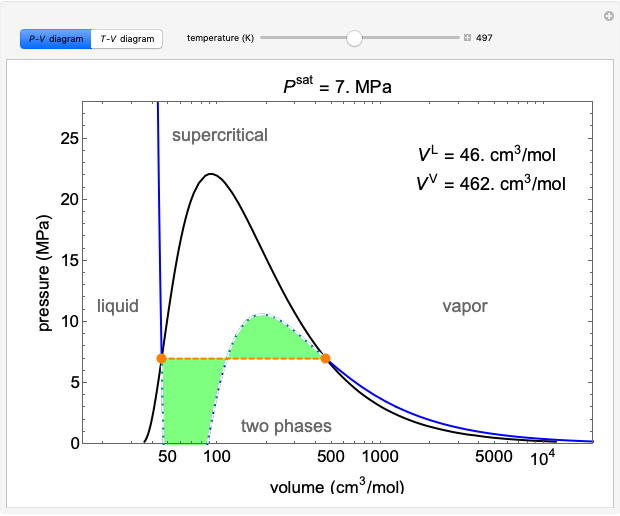 Single-Component P-V and T-V Diagrams
Rachael L. Baumann