Qualitative and Quantitative Aspects of Phase Transitions in Water


Requires a Wolfram Notebook System
Interact on desktop, mobile and cloud with the free Wolfram Player or other Wolfram Language products.
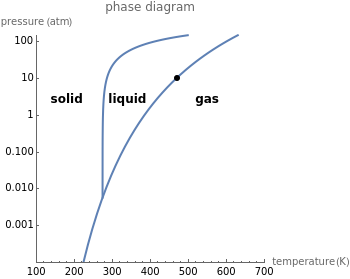
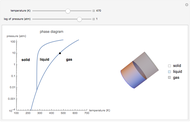
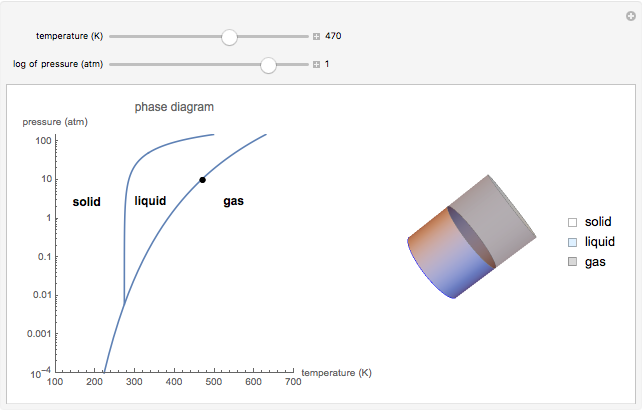
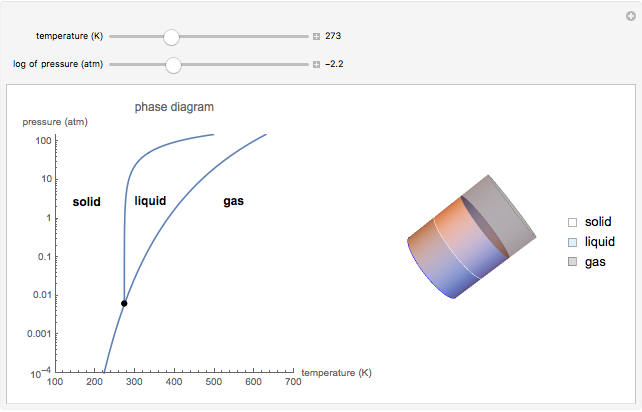
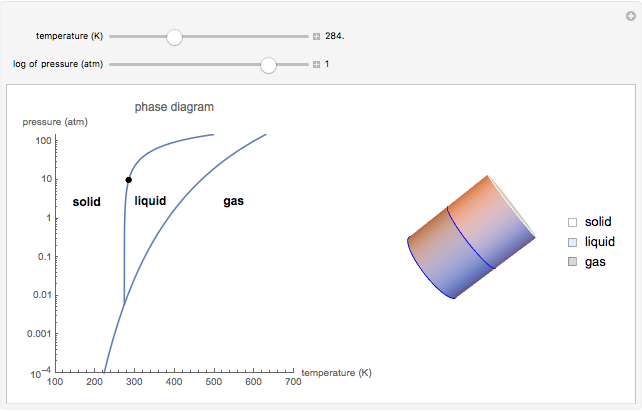
This Demonstration shows both the qualitative and quantitative behavior of phase changes in water. Use the sliders to vary the pressure and temperature and see the black point on the phase diagram move between regions. The lines separating each region are determined by the Clausius–Clapeyron equation. The beaker shows the physical states present—solid, liquid and gas—represented by different colors.
Contributed by: Jacqueline Kunesh, Vivek Parikh and Loren Thomas (January 2019)
(University of Michigan)
Open content licensed under CC BY-NC-SA
Details
Submission from the Compute-to-Learn course at the University of Michigan.
Reference
[1] Libretexts. "Clausius–Clapeyron Equation." (Nov 27, 2018) chem.libretexts.org/Textbook_Maps/Physical_and_Theoretical _Chemistry _Textbook _Maps/Supplemental_Modules_ (Physical_and _Theoretical _Chemistry)/Physical_Properties_of _Matter/States_of_Matter/Phase_Transitions/Clausius-Clapeyron_Equation.
Snapshots


Permanent Citation
 Adiabatic Compression of Water in Vapor-Liquid Equilibrium (VLE)
Rachael L. Baumann Heating Water and Air in a Sealed Container
Derek M. Machalek and Rachael L. Baumann Adiabatic Evaporation of Water into Vacuum
Neil Hendren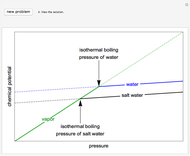 Identify Chemical Potential Plots
Neil Hendren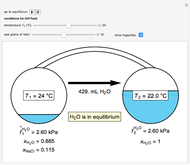 Fugacity as a Driving Force for Mass Transfer
Rachael L. Baumann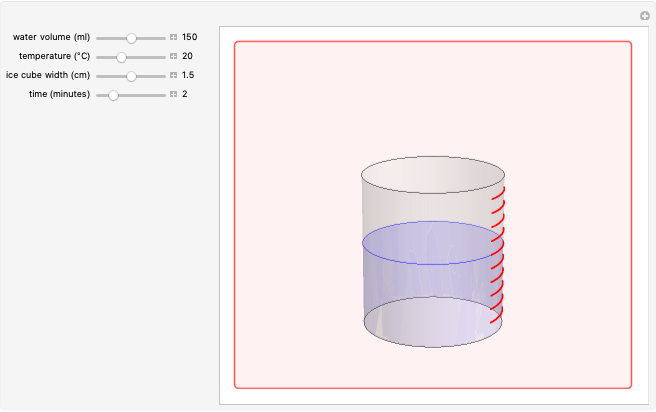 Ice Cube Melting in Water
S. M. Blinder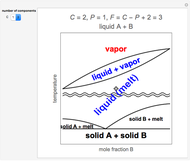 Gibbs Phase Rule for One- and Two-Component Systems
S. M. Blinder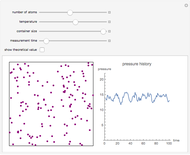 Simulation of a Simple Gas Pressure Model
Jon McLoone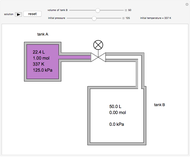 Adiabatic Gas Expansion between Two Tanks
Neil Hendren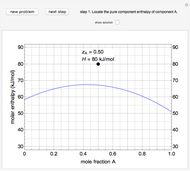 Partial Molar Enthalpy and Entropy Quiz
Neil Hendren