Recovering the Fourier Coefficients

Requires a Wolfram Notebook System
Interact on desktop, mobile and cloud with the free Wolfram Player or other Wolfram Language products.
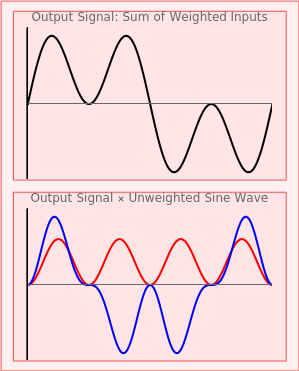
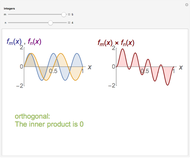
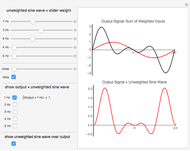
This Demonstration illustrates recovering the Fourier coefficients from a complex wave that you build. With the sliders you can select the weights of five sine wave signals, 1 to 5 Hz. These are summed into a complex signal in the upper graph. You can then selectively choose to multiply the entire output wave by any of the original unweighted signals. When selected, the resultant product waveforms are displayed in the lower graph. When these resultant waveforms are individually integrated or summed, the value of the integral is the original weight applied to the signal (after potentially dealing with scaling issues).
[more]
Contributed by: Ted Frazier (March 2012)
Open content licensed under CC BY-NC-SA
Snapshots
Details
In this Demonstration the horizontal center of either graph is always zero, because we are only using sine waves that are all in phase. The addition of cosine waves would create more realistic signals.
Snapshot 1: bottom graph is output signal times 1 Hz (top graph) and integrates to 1
Snapshot 2: bottom graph is output signal times 4 Hz (top graph) and integrates to 0
Snapshot 3: input signals weighed such that the middle of the output is flat
Snapshot 4: a squiggly triangle wave
Reference
[1] A. E. Richmond, Calculus For Electronics, 3rd ed., New York: McGraw–Hill, 1983.
Permanent Citation
"Recovering the Fourier Coefficients"
http://demonstrations.wolfram.com/RecoveringTheFourierCoefficients/
Wolfram Demonstrations Project
Published: March 26 2012
