Simulating a Catastrophe Insurer


Requires a Wolfram Notebook System
Interact on desktop, mobile and cloud with the free Wolfram Player or other Wolfram Language products.
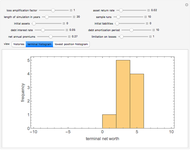
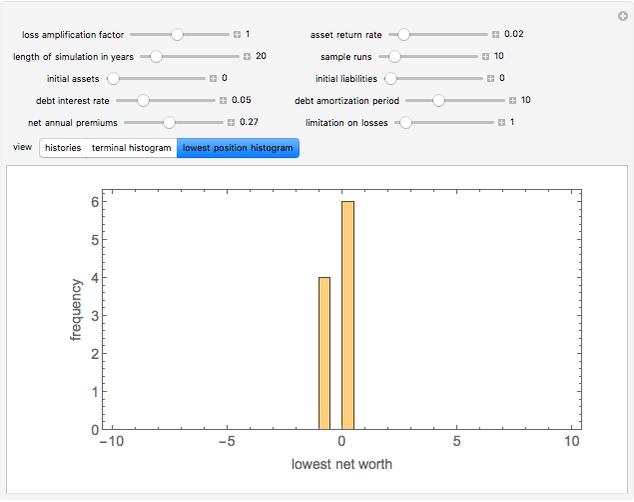
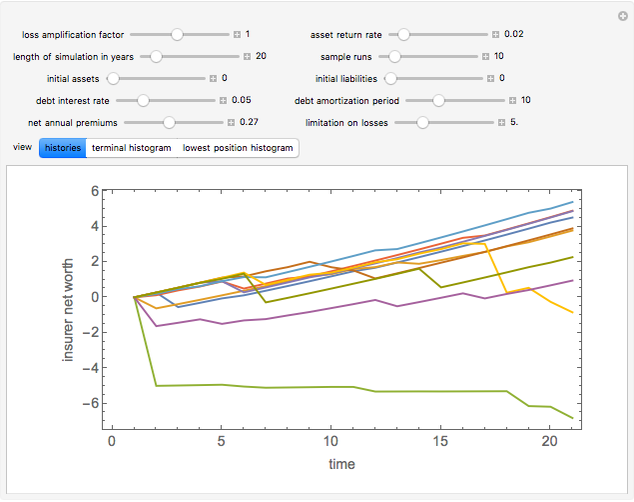
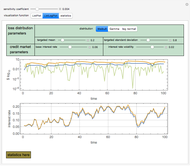
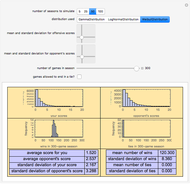
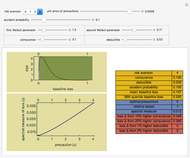
This Demonstration simulates the financial history of a catastrophe insurer. You select a variety of parameters that affect that financial history and the Demonstration responds with a graphic showing the annual net worth of the insurer for each of a user-chosen number of sample runs. You can also choose to display a histogram showing the distribution of the net worth of the insurer either at the end of the simulations or at its lowest annual value.
[more]
Contributed by: Seth J. Chandler (March 2011)
Open content licensed under CC BY-NC-SA
Snapshots


Details
The data from which the event sets are calculated is based on the projected losses of the Texas Windstorm Insurance Association from hurricanes as of 2007.
Snapshot 1: the distribution of the terminal net worth of the insurer using the default settings
Snapshot 2: the distribution of the lowest annual net worth of the insurer using the default settings
Snapshot 3: the financial history of the insurer if maximum losses are capped at 5 instead of the default value of 1
Snapshot 4: the financial history of the insurer if it has to borrow at 8% instead of the default value of 5%
Snapshot 5: the financial history of the insurer if losses are amplified by 50%
Snapshot 6: the financial history of the insurer if premiums are increased by about 50% over their default value
Snapshot 7: the financial history of the insurer using 50-year runs
Snapshot 8: the distribution of the lowest annual net worth of the insurer using 50-year runs
Permanent Citation
"Simulating a Catastrophe Insurer"
http://demonstrations.wolfram.com/SimulatingACatastropheInsurer/
Wolfram Demonstrations Project
Published: March 7 2011
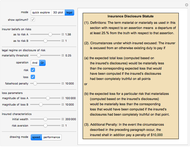 Insurance Disclosures
Seth J. Chandler Efficient Single Limit Liability Insurance
Seth J. Chandler Risk Aversion, Load, and Optimal Insurance
Seth J. Chandler Subrogation
Seth J. Chandler Life Insurance Pricing
Seth J. Chandler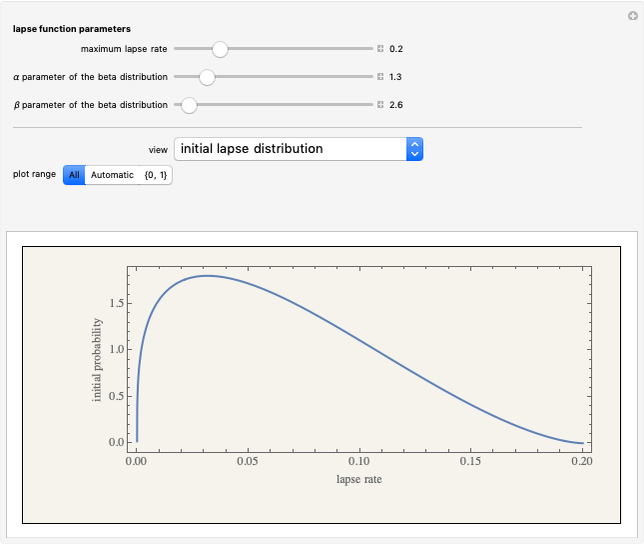 A Theory of Insurance Lapses
Seth J. Chandler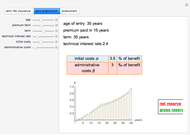 Net and Gross Reserve of Life Insurance
Gergely Nagy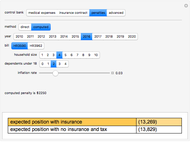 Individual Insurance Decisions under HR 3560 and HR 3962
Seth J. Chandler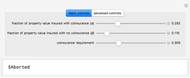 Property Coinsurance
Seth J. Chandler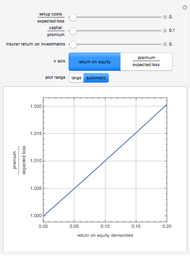 Premium Ratios with Capital Costs Included
Seth J. Chandler
-
 Post-Event Bonding
Seth J. Chandler -
 Emulating Land Use Evolution with a Cellular Automaton
Seth J. Chandler -
 General Assembly Resolution Viewer
Seth J. Chandler -
 Random Acyclic Networks
Seth J. Chandler -
A Theory of Insurance Lapses
Seth J. Chandler -
 Asylum in the United States
Seth J. Chandler -
Property Coinsurance
Seth J. Chandler -
 The Persuasion Effect: A Traditional Two-Stage Jury Model
Seth J. Chandler -
 Cellular Automata with Global Control
Seth J. Chandler -
 Sports Seasons Based on Score Distributions
Seth J. Chandler -
 Evidentiary Uncertainty
Seth J. Chandler -
 Spectral Measures
Seth J. Chandler -
 The Banzhaf Power Index of States for Presidential Candidates
Seth J. Chandler -
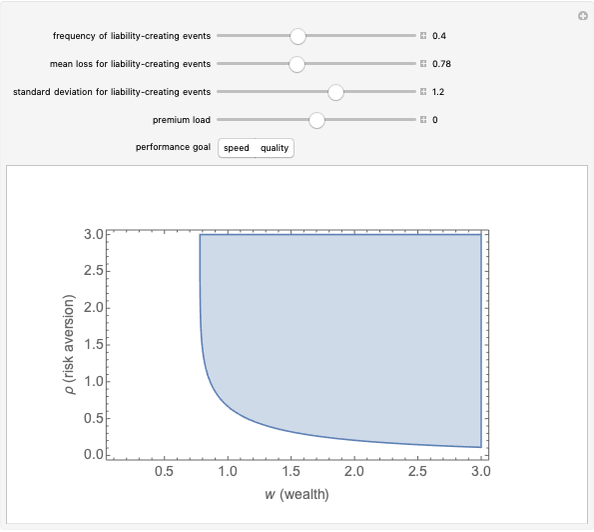 Liability Insurance Desirability under Lognormal Loss Distributions
Seth J. Chandler -
 The Effects of Coinsurance and Deductibles on Optimal Precautions for Weibull-Distributed Loss
Seth J. Chandler -
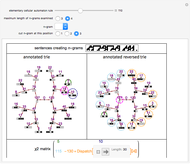 Collocation by Chi Square
Seth J. Chandler -
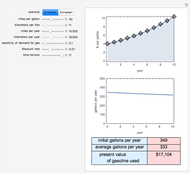 The Present Value of Future Gas Use
Seth J. Chandler -
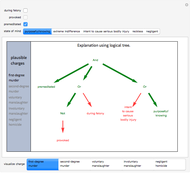 Visualizing Legal Rules: A Homicide Case
Seth J. Chandler -
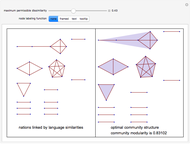 Communities of Nations Bridged by Language Similarity
Seth J. Chandler