Smooth Density Histograms for Cellular Automata
Initializing live version


Requires a Wolfram Notebook System
Interact on desktop, mobile and cloud with the free Wolfram Player or other Wolfram Language products.
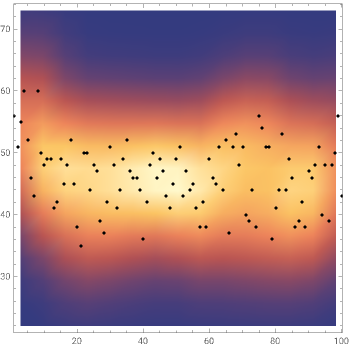
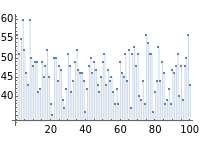
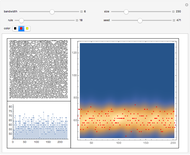
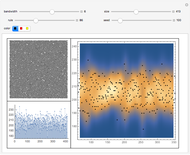
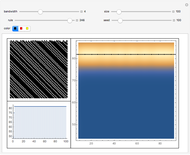
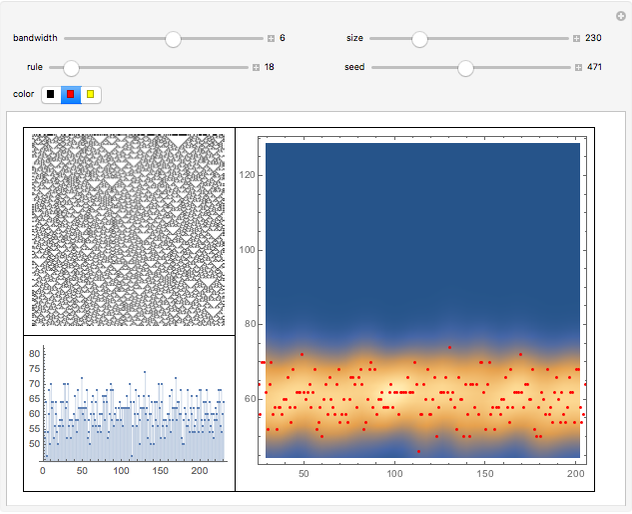
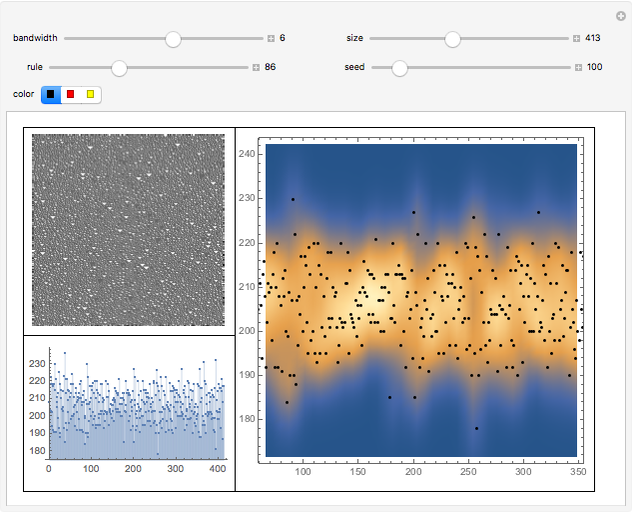
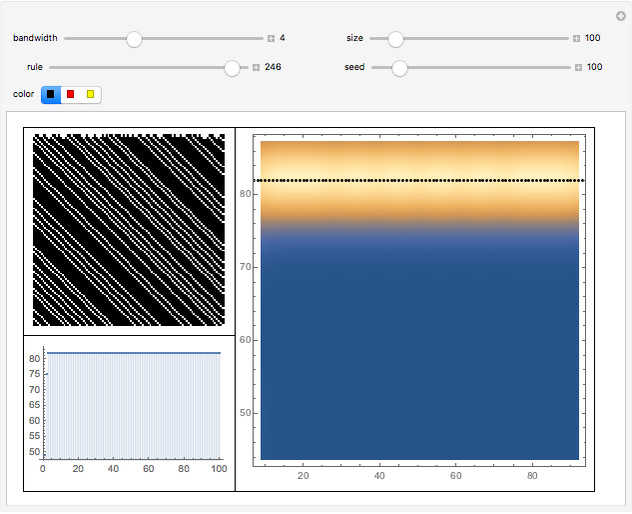
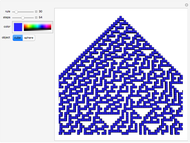
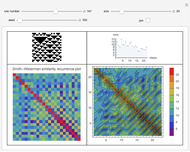
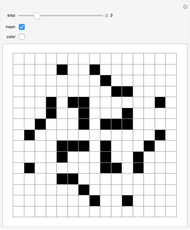
A cellular automaton's smooth density histogram can show the clustering of points in its time series and enables recognition of one of the four classes of behavior for cellular automata. The histogram in the lower left of the graphic shows the original density (fraction of black cells) as a function of the number of steps. The yellow cloud in the right panel represents the distribution obtained using SmoothDensityHistogram in Mathematica.
[more]
Contributed by: Daniel de Souza Carvalho (November 2015)
Open content licensed under CC BY-NC-SA
Snapshots
Details
Permanent Citation
Related Demonstrations
More by Author
 3D Views of Elementary Cellular Automata
Daniel de Souza Carvalho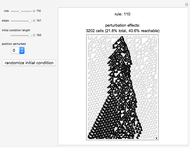 Cellular Automata Sensitivity to Initial Conditions
Hector Zenil and Elena Villarreal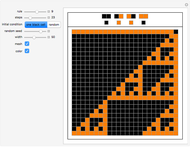 Radius-1/2 Cellular Automata
Daniel de Souza Carvalho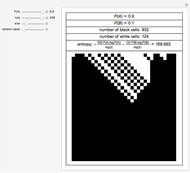 Cellular Automata Entropy
Daniel de Souza Carvalho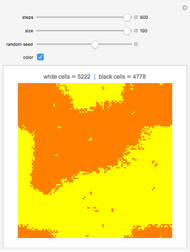 Cluster Cellular Automata
Daniel de Souza Carvalho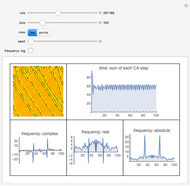 Frequency of Cellular Automata
Daniel de Souza Carvalho Elementary Cellular Automata with Short Initial Condition
Daniel de Souza Carvalho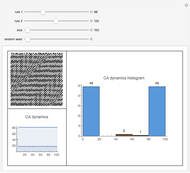 Histogram of Flipping Cellular Automaton
Daniel de Souza Carvalho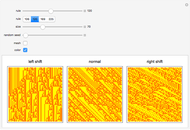 Shifted Elementary Cellular Automata
Daniel de Souza Carvalho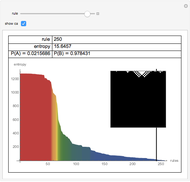 Cellular Automata Ordered by Entropy
Daniel de Souza Carvalho
-
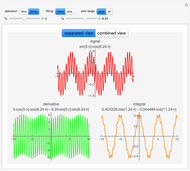 Integrating and Differentiating Trigonometric Signals
Daniel de Souza Carvalho -
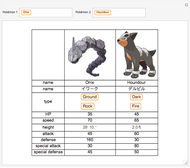 Comparing Pokémon
Daniel de Souza Carvalho -
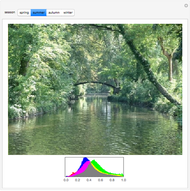 Image Histograms of the Four Seasons
Daniel de Souza Carvalho -
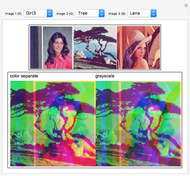 Combining Image Color Layers
Daniel de Souza Carvalho -
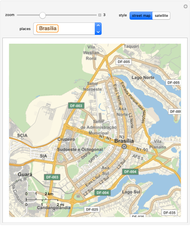 View Our Small World
Daniel de Souza Carvalho -
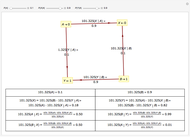
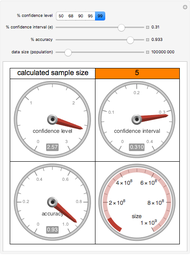 Calculating Sample Size
Daniel de Souza Carvalho -
Cellular Automata Ordered by Entropy
Daniel de Souza Carvalho -
 Smooth Density Histograms for Cellular Automata
Daniel de Souza Carvalho -
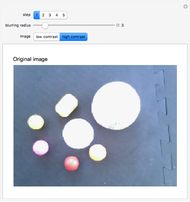 Counting Objects in Images
Daniel de Souza Carvalho -
Frequency of Cellular Automata
Daniel de Souza Carvalho -
 Applying the Smith-Waterman Similarity to Cellular Automata
Daniel de Souza Carvalho -
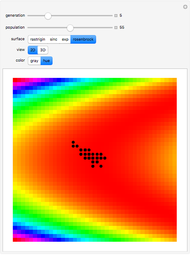 Global Minimum of a Surface
Daniel de Souza Carvalho -
 Probability in a Communication Channel
Daniel de Souza Carvalho -
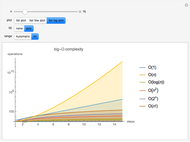 Algorithmic Complexity and Big-O Notation
Daniel de Souza Carvalho -
Elementary Cellular Automata with Short Initial Condition
Daniel de Souza Carvalho -
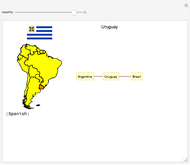 Languages in South American Countries
Daniel de Souza Carvalho -
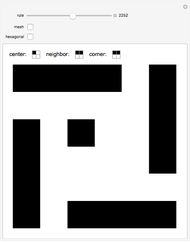
 The Turbine Pattern in the Game of Life
Daniel de Souza Carvalho -
 Combining Blocks
Daniel de Souza Carvalho -
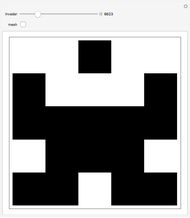 Invaders from the Computational Universe
Daniel de Souza Carvalho -
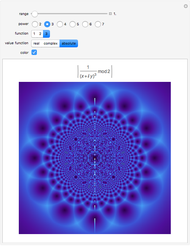 Patterns from Math Rules Using Complex Numbers
Daniel de Souza Carvalho