The Lorenz Curve and Various Economic Indices


Requires a Wolfram Notebook System
Interact on desktop, mobile and cloud with the free Wolfram Player or other Wolfram Language products.
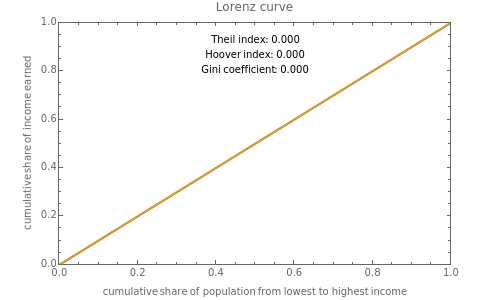
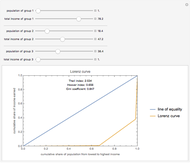
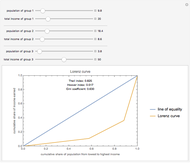
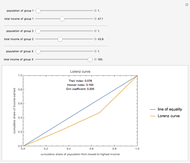
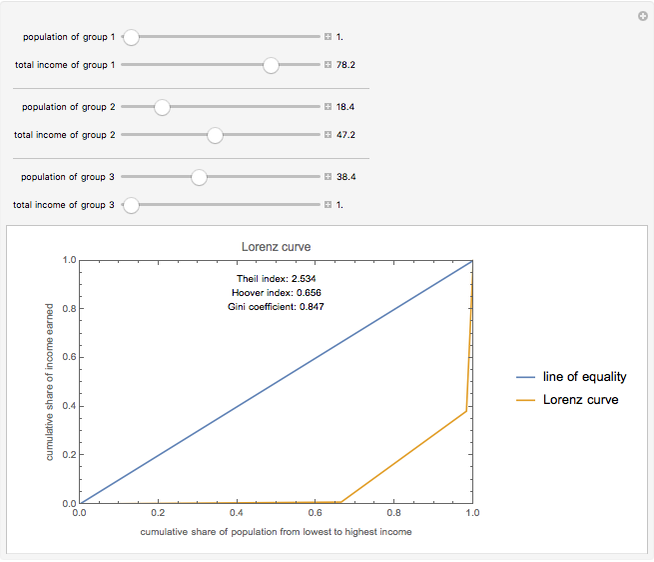
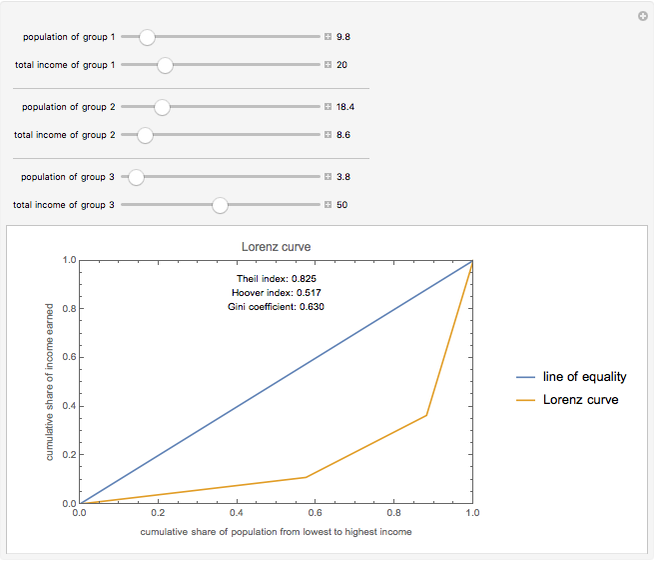
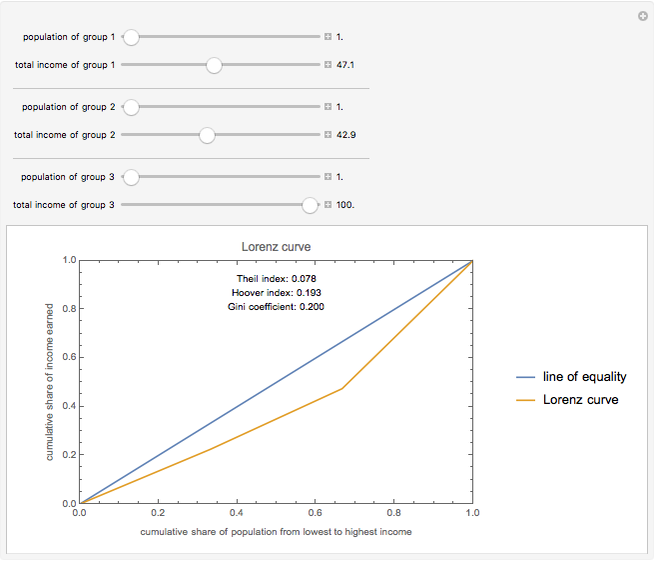
The Lorenz curve is a plot of the cumulative share of the income earned by the cumulative share of the population, with population ordered from lowest to highest incomes. The Gini coefficient is the area between the line of perfect equality and the Lorenz curve divided by the total area under the line of perfect equality, with 0 representing perfect equality and 1 representing perfect inequality. The Hoover index is the portion of income that would need to be redistributed to achieve perfect equality. The Theil index is an entropy index that can be viewed as a measure of redundancy; it is the weighted average of inequality within subgroups and, unlike the Gini coefficient, can be decomposed to view the individual Theil index of subgroups.
[more]
Contributed by: Shreyas S. Gandlur and Craig Soares (June 2015)
Open content licensed under CC BY-NC-SA
Snapshots
Details
Special thanks to the NetMath Program at the University of Illinois at Urbana-Champaign and the Math Department at Schaumburg High School.
Reference
[1] P. D. Allison, "Measures of Inequality," American Sociological Review, 43(6), 1978 pp. 865–880. www.jstor.org/stable/2094626.
Permanent Citation
"The Lorenz Curve and Various Economic Indices"
http://demonstrations.wolfram.com/TheLorenzCurveAndVariousEconomicIndices/
Wolfram Demonstrations Project
Published: June 18 2015
 Net Lease Economics
Roger J. Brown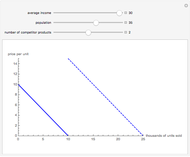 Shifts in the Demand Curve
Sarah Lichtblau Short-Run Cost Curves
William J. Polley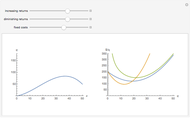 Short-Run Production and Cost Curves
Tom Creahan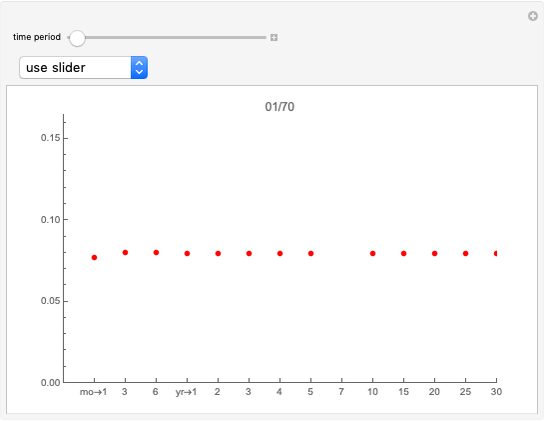 Term Structure of Interest Rates
Roger J. Brown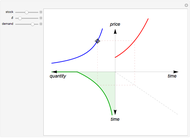 Non-Renewable Resource Economics
Arne Eide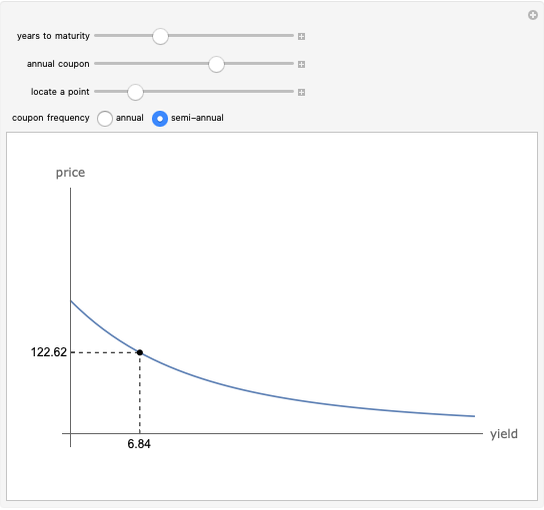 Price-Yield Curve
Fiona Maclachlan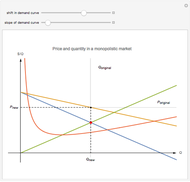 No Supply Curve in a Monopolistic Market
Samuel G. Chen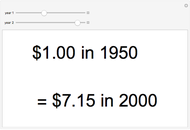 Purchasing Power Calculator
Fiona Maclachlan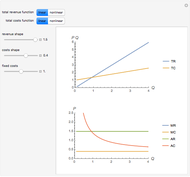 Revenue and Costs Curves Analysis
Timur Gareev
