Revenue and Costs Curves Analysis

Requires a Wolfram Notebook System
Interact on desktop, mobile and cloud with the free Wolfram Player or other Wolfram Language products.
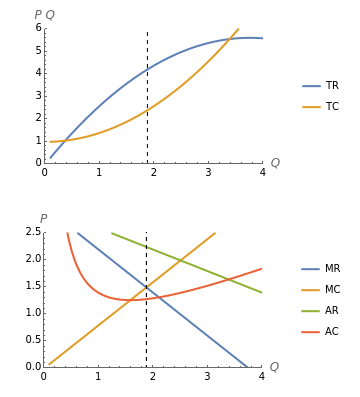
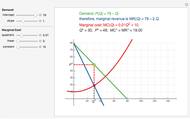
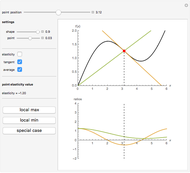
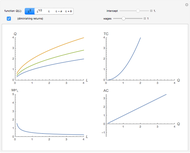
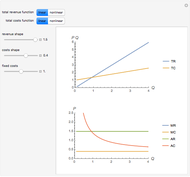
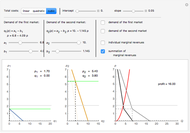
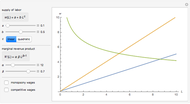
The purpose of this Demonstration is to compare four feasible combinations of curves of revenues and costs. Each case is shown both in the scale of total values (top plot) and in the scale of average/marginal values (bottom plot). So, we consider three combinations compatible with economic theory, which make sense for optimization analysis (at least one of the curves on the total scale is nonlinear), and one simplistic linear-linear case, which is often used in practical breakeven point analysis.
[more]
Contributed by: Timur Gareev (March 2018)
Open content licensed under CC BY-NC-SA
Snapshots
Details
Profit is the difference between total revenue and total costs for a certain volume of production,  . Profitability analysis in economic theory is based on the optimization problem
  , which is just a fancy way of writing down the first-order condition for profit optimization,
  . Profit optimization makes sense if at least one of those curves on the top plot is nonlinear. Thus, in economic theory, there are only three out of four options available.
In the "linear-linear" case, a reasonable limit should be set for the quantity of  , otherwise, profit is unlimited (the dashed line reflecting optimal quantity disappears).
The case with linear total revenue corresponds to perfect competition, whereas nonlinear total revenues are typical for monopolies; therefore, a monopoly with linear total costs is often used for natural monopoly modeling.
For competitive cases,  coincides with
  and degenerates into a horizontal line (which is also known as the individual demand curve in a competitive market). There is no market power involved.
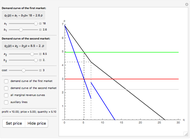
In monopoly cases,  , which corresponds to demand for a monopolist market, is sloped down and
  descends below it. This opens the room for market power.
It is instructive to change the setter bar to study how the bottom plot curves correspond to the top plot curves and to each other for all four combinations.
Permanent Citation
