Z Values from Integrals over the Normal Probability Density Function

Requires a Wolfram Notebook System
Interact on desktop, mobile and cloud with the free Wolfram Player or other Wolfram Language products.
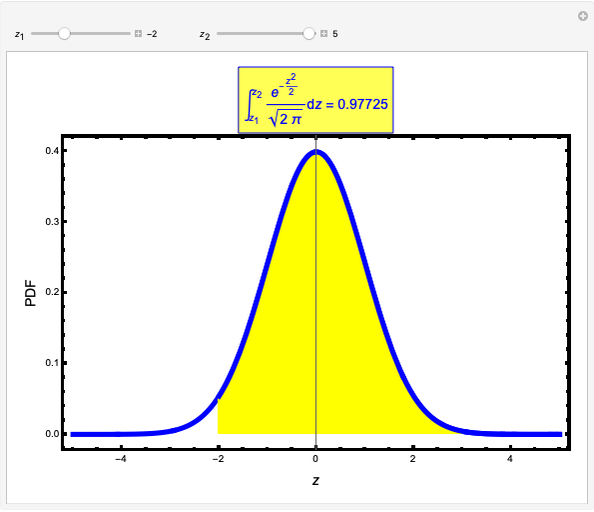
In this Demonstration, we compute integrals over the normal probability density function between two values,  and
and  . Each
  -score represents the number of standard deviations away from the mean, defined as
  , where
  is some value or measure,
  is the population mean and
  is the standard deviation. When integrating between two values of
  , the integral gives the probability or confidence interval for a measurement between these two values. For example, given a sample of tensile specimens with a population mean length of 1m and a standard deviation of 0.1m, the probability of finding a sample between 1.1m and 1.2m can be found by integrating between
  limits of
  and
and  . This would give a probability of approximately 13.6% for finding a sample between these
  bounds.
Contributed by: Ethan Hall, Michael Pappas and Joshua Paul Steimel (May 2021)
Open content licensed under CC BY-NC-SA
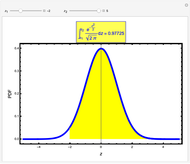
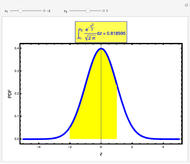
Snapshots


Details
Reference
[1] J. Steimel, Instrumentation and Experimentation, University of the Pacific. (Feb 23, 2020) scholarlycommons.pacific.edu/open-textbooks/13.
Permanent Citation
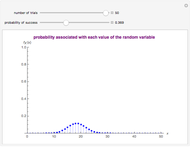 Binomial Probability Distribution
Paul Savory (University of Nebraska ? Lincoln)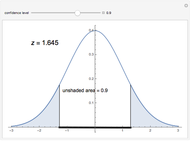 Critical Value z* for z-Scores for Confidence Levels
Emily Hou and Esha Madhekar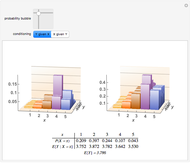 A Conditional Probability Mass Function
Chris Boucher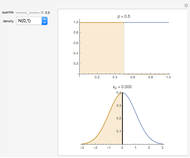 Random Values from Distributions
Chris Boucher Informal Power Assessment of the Normal Probability Plot
Ian McLeod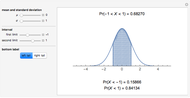 Finding Probabilities for Intervals of a Normal Distribution
Juan D. Montoro-Pons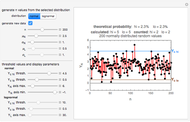 Failure Probabilities from Quality Control Charts
Mark D. Normand and Micha Peleg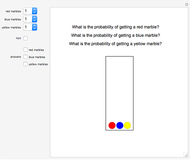 Marble Probability
Hyeongeun Park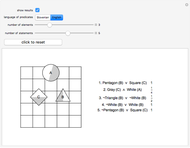 Probability Logic Test
Izidor Hafner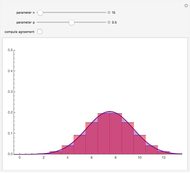 Normal Approximation to a Binomial Random Variable
Chris Boucher