Kinetics of CFC Catalyzed Ozone Destruction


Requires a Wolfram Notebook System
Interact on desktop, mobile and cloud with the free Wolfram Player or other Wolfram Language products.
Chlorofluorocarbons (CFCs) catalyze the decomposition of ozone into molecular oxygen. This Demonstration shows the increase of CFC concentration in the atmosphere and how it affects the rate of decomposition of ozone. Data from four similar CFCs are used. The thinning of the ozone layer (shown in green) over time is shown. Four different CFCs are considered:  (CFC11),
  (CFC12),
  (CFC113), and
  (carbon tetrachloride).
Contributed by: Edward Li and James Feng (June 2016)
Special thanks to the University of Illinois NetMath Program and the mathematics department at William Fremd High School.
Open content licensed under CC BY-NC-SA
Snapshots


Details
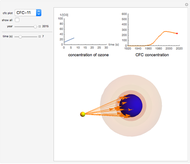
Snapshot 1: CFC-11 concentration in 2015 after 20 seconds
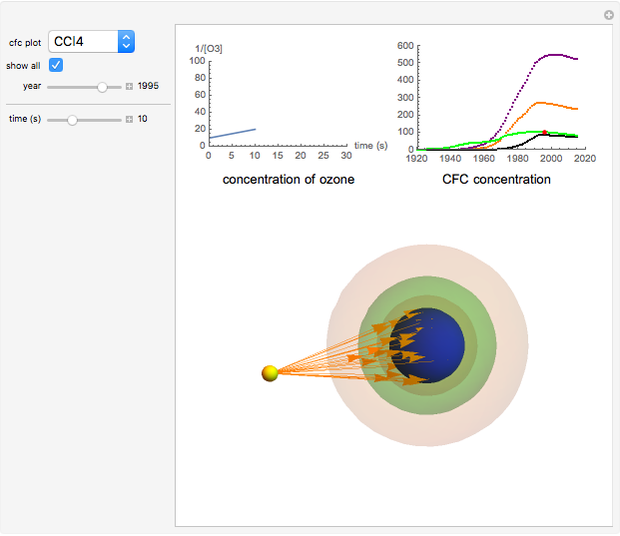
Snapshot 2:  disappearing after 30 seconds in 1995 from CFC-113
Snapshot 3: all CFC plots shown with cursor on CCl4 after 10 seconds
This Demonstration explores the effect that chlorofluorocarbons (CFCs) have on the decomposition of (ozone) into  (oxygen).
CFCs act as catalysts in ozone depletion. Catalysts are compounds that accelerate a reaction by providing an alternate mechanism that has low activation energy. They are not consumed in the reaction, so they are dangerous for the Earth’s ozone layer. One molecule can catalyze the destruction of millions of ozone molecules. Ozone decomposes without the presence of a catalyst relatively slow. The rate of decomposition of ozone depends on the concentration of reactants, and the atmospheric concentration of different CFCs has increased drastically since the early 20th century.
The rate law for the decomposition of ozone is given by  . In the atmosphere, the concentration of is so large that its value is essentially constant. Thus, this is a second-order reaction, so the linearization is given by a
  versus time relationship, where the slope of the line is the rate at which is destroyed.
This Demonstration includes the following controls:
- A drop-down menu to select a specific CFC concentration visualization.
- A checkbox to show the concentrations of all four CFCs from 1920 to 2015.
- A "year" slider that adjusts the CFC concentration and subsequent rate of change of by year.
- A "time" slider that helps visualize the depletion of ozone with respect to time. This slider also adjusts a 3D visualization of an ozone-Earth system; as the concentration decreases, more harmful UVB rays originating from the Sun reach the Earth's surface.
References
[1] J. Bullister. "Atmospheric CFC-11, CFC-12, CFC-113, CCl4, and SF6 Histories (1910–2014)." (Jun 9, 2016) cdiac.ornl.gov/oceans/new_atmCFC.html.
[2] J. M. Standard. "Mechanism Case Study: Gas Phase Decomposition of Ozone." (Jun 9, 2016) chemistry.illinoisstate.edu/standard/che360/handouts/360ozonemech.pdf.
[3] M. J. Molina and F. S. Rowland. "Stratospheric Sink for Chlorofluoromethanes: Chlorine Atom-Catalysed Destruction of Ozone." (Jun 9, 2016) www.unep.ch/ozone/pdf/stratopheric.pdf.
Permanent Citation
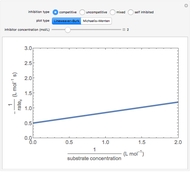 Enzyme Inhibition Kinetics
Nicholas R. Larson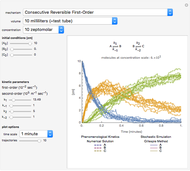 Deterministic versus Stochastic Chemical Kinetics
Brian M. Frezza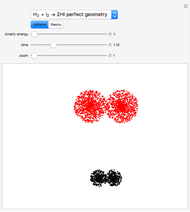 Single-Step Reaction Kinetics Using Collision Theory
D. Meliga and S. Z. Lavagnino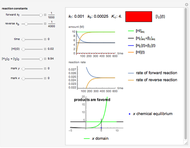 Chemical Equilibrium and Kinetics for HI Reaction
S. Z. Lavagnino and D. Meliga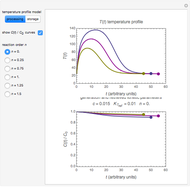 Extracting Fixed-Order Degradation Kinetics by the Endpoints Method
Mark D. Normand and Micha Peleg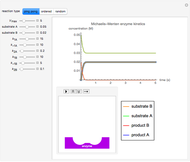 Michaelis-Menten Enzyme Kinetics of Bi-Bi Reactions
Bailey Schneider and Matthew Wick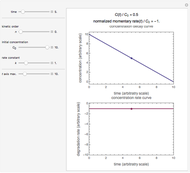 Kinetic Order of Degradation Reactions
Mark D. Normand and Micha Peleg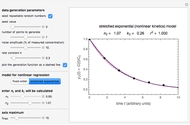 Fit of First-Order Kinetic Model in Degradation Processes
Mark D. Normand and Micha Peleg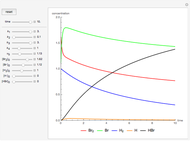 Synthesis of Hydrogen Bromide by Free-Radical Chain Reaction
Edward Li and Akash Mukherjee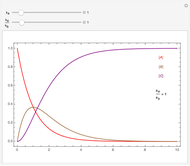 Consecutive Exponential Decay
Gerhard Schwaab and Chantal Lorbeer (Ruhr University Bochum)