Sampling Theorem
Initializing live version


Requires a Wolfram Notebook System
Interact on desktop, mobile and cloud with the free Wolfram Player or other Wolfram Language products.
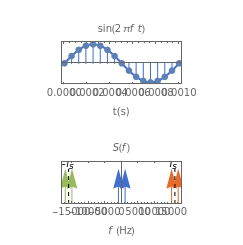
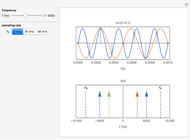
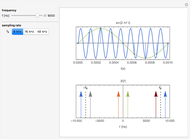
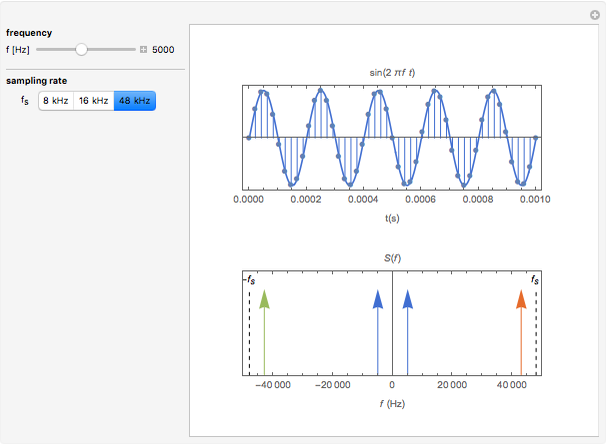
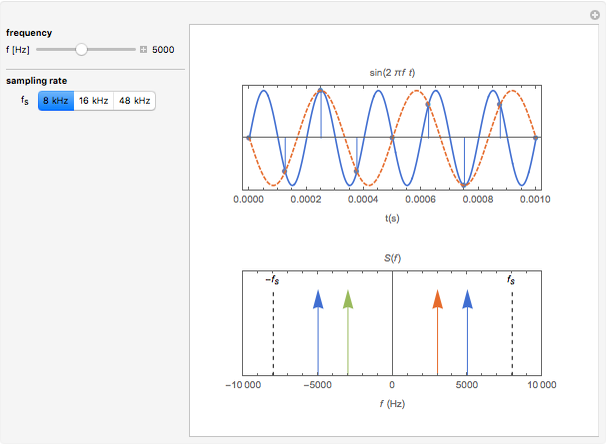
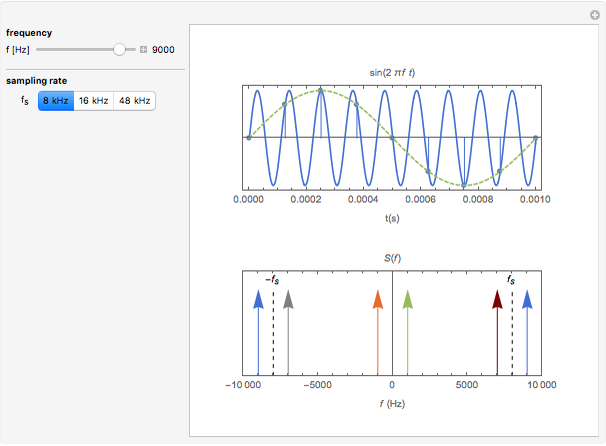
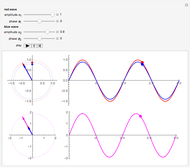
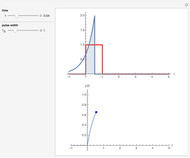
The top figure shows a sine wave of frequency  and its samples. The bottom figure shows the Fourier spectrum
  of the sampled signal. It consists of two spectral lines at
  , repeated periodically at integer multiples of the sampling rate
  .
.


Contributed by: Carsten Roppel (March 2011)
Open content licensed under CC BY-NC-SA
Snapshots

Details
Permanent Citation
Related Demonstrations
More by Author
 Polynomial Fits of Random Walks
Michael Schreiber Acceptance/Rejection Sampling
Ryan Carroll and Jeff Hamrick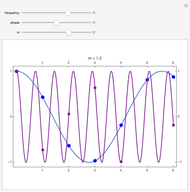 Aliasing in Time Series Analysis
Ian McLeod Distributions of Order Statistics
Chris Boucher Estimating a Centered Ornstein-Uhlenbeck Process under Measurement Errors
Didier A. Girard Central Limit Theorem Applied to Samples of Different Sizes and Ranges
Mark D. Normand and Micha Peleg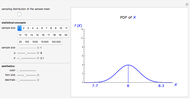 Sampling Distribution of the Sample Mean
Jim R Larkin Distributions Using Slice Sampling
Oliver K. Ernst Monte Carlo Sampling Coverage
Richard Roe Sampling Distribution of the Mean and Standard Deviation in Various Populations
Ian McLeod
-
 Sum of Sines
Carsten Roppel -
 Discrete-Time Convolution
Carsten Roppel -
 Harmonic Distortion of Nonlinear Transfer Functions
Carsten Roppel -
 Digital Modulation: Quadrature Phase-Shift Keying (QPSK) Signal Constellation and Eye Diagrams
Carsten Roppel -
 Discrete Fourier Transform of a Two-Tone Signal
Carsten Roppel -
 Sampling Theorem
Carsten Roppel -
 Convolution with a Rectangular Pulse
Carsten Roppel