Single Factor Analysis of Variance


Requires a Wolfram Notebook System
Interact on desktop, mobile and cloud with the free Wolfram Player or other Wolfram Language products.
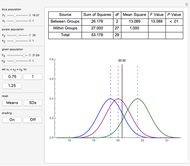
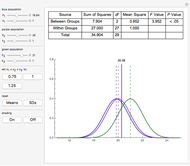
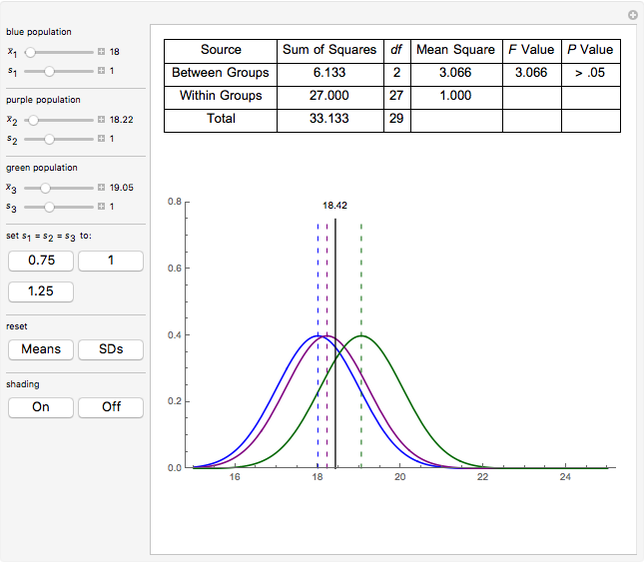
This Demonstration shows how a single factor analysis of variance (ANOVA) works. There are three groups, each with sample size 10. You can change the mean or standard deviation of each group separately and observe the changes in the ANOVA table of results. The black line represents the grand mean and its value is at the top of the line. The significance of  is provided as
  ,
,  , or
, or  based on a regular table for the distribution of
  at 2 and 27 degrees of freedom.
Contributed by: Scott R. Colwell (July 2011)
Open content licensed under CC BY-NC-SA
Snapshots
Details
The formulas underlying this Demonstration are based on the method for estimating an ANOVA with summary data as found in [1].
Reference
[1] D. A. Larson, "Analysis of Variance with Just Summary Statistics as Input," American Statistician, 46, 1992 pp. 151–152.
Permanent Citation
"Single Factor Analysis of Variance"
http://demonstrations.wolfram.com/SingleFactorAnalysisOfVariance/
Wolfram Demonstrations Project
Published: July 20 2011
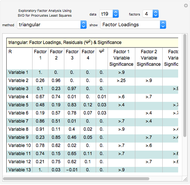 Exploratory Factor Analysis
Stuart Nettleton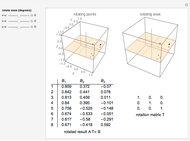 Pairwise Axes Rotations in Factor Analysis
Steve Hunka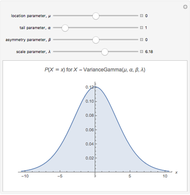 Variance-Gamma Distribution
Peter Falloon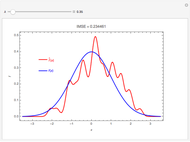 Variance-Bias Tradeoff
Ian McLeod Granger-Orr Running Variance Test
Roger J. Brown ABC Analysis
Michael Schreiber Comparing Two Means Using Independent Samples of Unknown Variance
Shailesh S. Kulkarni and Hakan Tarakci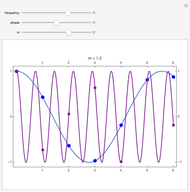 Aliasing in Time Series Analysis
Ian McLeod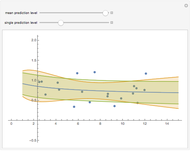 Mean and Single Prediction Bands for a Nonlinear Model
Darren Glosemeyer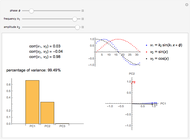 Loading Plot of a Principal Component Analysis (PCA)
D. Meliga and S. Z. Lavagnino