Ellipse Representing the Confidence Region of a Covariance Matrix


Requires a Wolfram Notebook System
Interact on desktop, mobile and cloud with the free Wolfram Player or other Wolfram Language products.
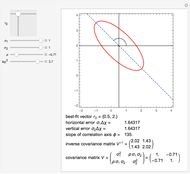
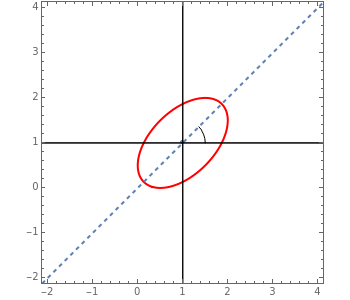
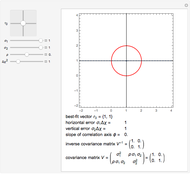
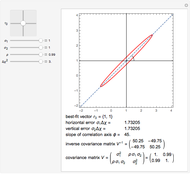
This Demonstration shows the confidence region defined by a covariance matrix. The equation of the contour of the region is given by 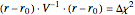 , where
  is the best-fit vector and
  is the covariance matrix. The parameter
  is the large data sample limit corresponding to a coverage probability and characterizes the confidence level (e.g.
  in the 2D case and 68.3% CL). The dashed blue line represents the direction of the parameters correlation.
Contributed by: A. V. Pimikov ( {MonthName, Year, Day})
Open content licensed under CC BY-NC-SA
Snapshots


Details
References
[1] G. D. Cowan, Statistical Data Analysis, New York: Oxford University Press, 1998.
[2] R. J. Barlow, Statistics: A Guide to the Use of Statistical Methods in the Physical Sciences, New York: John Wiley, 1989.
Permanent Citation
"Ellipse Representing the Confidence Region of a Covariance Matrix"
http://demonstrations.wolfram.com/EllipseRepresentingTheConfidenceRegionOfACovarianceMatrix/
Wolfram Demonstrations Project
Published: Part[DateValue[, {MonthName, Year, Day}], 3] {MonthName, Year, Day}
 The Envelope Theorem: Numerical Examples
Jeff Hamrick Kernel Density Estimation
Jeff Hamrick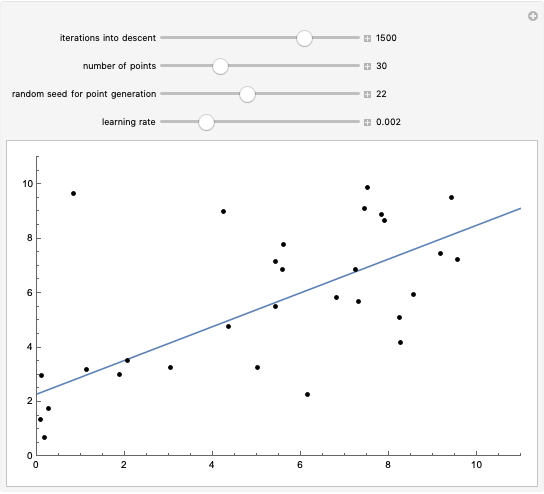 Linear Regression with Gradient Descent
Jonathan Kogan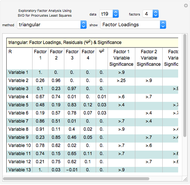 Exploratory Factor Analysis
Stuart Nettleton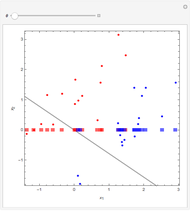 Fisher Discriminant Analysis
Ian McLeod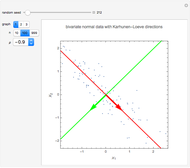 Principal Components
Ian McLeod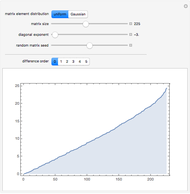 Eigenvalues of Random Symmetric Matrices
Stephen Wolfram and Michael Trott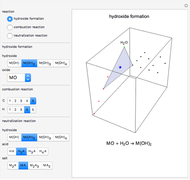 Chemical Reactions Represented via a 3D Simplex
D. Meliga and S. Z. Lavagnino Nonparametric Regression and Kernel Smoothing: Confidence Regions for the L2-Optimal Curve Estimate
Didier A. Girard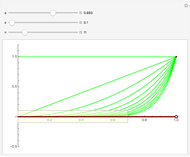 Uniform Convergence of a Sequence of Functions