Examples of Limits of Real Sequences


Requires a Wolfram Notebook System
Interact on desktop, mobile and cloud with the free Wolfram Player or other Wolfram Language products.
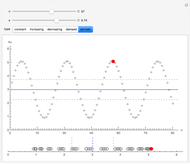
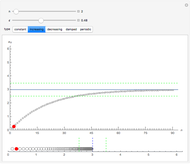
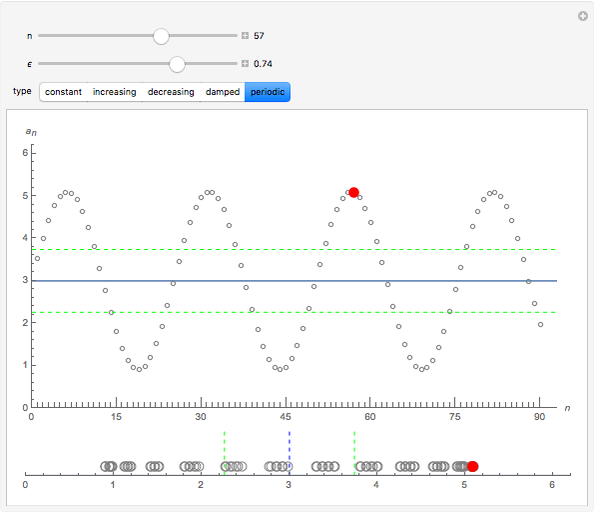
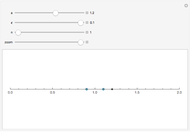
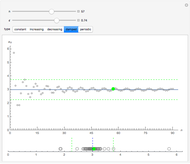
Each of the sequences except for the periodic one appear to converge to 3. The  slider lets you vary the tolerance limit in the definition of the limit. The
  slider lets you plot the
  element of the sequence. The color of the point representing the element of the sequence is green within the tolerance region, and red otherwise.
Contributed by: Christine Herrera and Alexander White (June 2016)
Open content licensed under CC BY-NC-SA
Snapshots


Details
This Demonstration explores the formal definition of the limit of a sequence: a sequence of real numbers  converges to a real number
  if for every
  there exists a natural number
  such that
  for all
  .
.
Use this Demonstration to explore how the different aspects of the formal language of the - definition relates to the five examples of sequences shown.
The concept of limits of sequences is one that students first explore in calculus and later in analysis. Literature has shown that the concept of limits poses potential difficulty for students [2, 4]. In particular, students typically struggle to shift their informal notions of limits to encompass the complexity of the formal definition. Throughout this transition, students draw upon their example space, i.e. the set of examples with which they are familiar [5], and build upon it to make sense of all the different aspects of the formal definition, such as the absolute value inequality, the roles of the universal and existential quantifiers, and the functional relationship between and .
It is important to note that as students utilize examples to understand the formal definition, there is a potential for cognitive conflict if an example is presented in a visual model that varies from the one that dominates a student’s example space. Students' example spaces may be dominated by either the number line model or the Cartesian plane, and they may have difficulty transitioning between the two different visual models [2]. Thus, to reduce the potential cognitive conflict, the dynamic Mathematica graphs are designed to help students expand their example space to incorporate both models and explore how different examples and their properties relate to the formal definition. Similar dynamic graphs have been shown to help students visualize and understand the formal mathematical language of limits [1, 3].
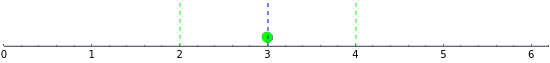
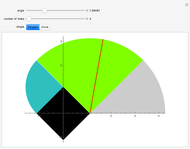
1. Notice the top dynamic model plots the sequence on a Cartesian plane where the horizontal axis is labeled and the vertical axis . The same sequence is plotted below on the number line; should it not be labeled or ? Compare the two models: Why is the orientation of the ϵ tolerances different for each of the models? How do they relate?
2. Choose the constant sequence. Move the slider. Move the slider. The color of the point representing is always green. Why is this true? Relate this to the definition of the limit.
3. Choose the increasing sequence. Move the slider. Move the slider. The color of the point representing is sometimes green and sometimes red. Why is this true? Relate this to the definition of the limit. Set  . What is the smallest value of for which the point is green—that is, within of the limit? What is the color for subsequent members of the sequence? What does this tell you about the value of in the limit definition for this choice of ? If you choose
  , how does the value change? Can you find an algebraic form for a sequence that exhibits this behavior—that is, increasing to a limit of 3?
4. Choose the decreasing sequence. How is the situation similar to what happens for the increasing sequence? How is it different? Can you modify the algebraic expression you wrote down for the increasing sequence to create a decreasing sequence with a limit of 3?
5. Click the damped sequence. Set . What is the smallest value of for which the point is green—that is, within of the limit? What is the color for subsequent members of the sequence? Are they all green? For this value of , what is the smallest value of for which all the subsequent elements of the sequence are within of the limit? What does this tell you about the quantifier "for all  " in the limit definition?
6. Click the periodic sequence. Set . What is the smallest value of for which the point is green—that is, within of the limit? What is the color for subsequent members of the sequence? Are they all green? For this value of , is there a value of for which all the subsequent elements of the sequence are within of the limit? What does this tell you about the quantifier "for all " in the limit definition?
References
[1] B. L. Cory and J. Garofalo, "Using Dynamic Sketches to Enhance Preservice Secondary Mathematics Teachers’ Understanding of Limits of Sequences," Journal for Research in Mathematics Education, 42(1), 2011 pp. 65–97.
[2] C. A. Herrera, "An Investigation of the Relationships between Conceptualization of Limits and Proof Comprehension," PhD dissertation, Texas State University, Texas, 2016.
[3] I. Kidron and N. Zehavi, "The Role of Animation in Teaching the Limit Concept," International Journal of Computer Algebra in Mathematics Education, 9(3), 2002 pp. 205–227.
[4] D. Tall and S. Vinner, "Concept Image and Concept Definition in Mathematics with Particular Reference to Limits and Continuity," Educational Studies in Mathematics, 12(2), 1981 pp. 151–169.
[5] A. Watson and J. Mason, "Extending Example Spaces as a Learning/Teaching Strategy in Mathematics," in PME CONFERENCE 26, 4, 2002 p. 377.
Permanent Citation
 Limit of the Sequence a^(1/n)
Izidor Hafner A Monotone Sequence Bounded by e
Soledad Mª Sáez Martínez and Félix Martínez de la Rosa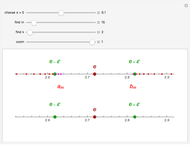 Three Sequences with Limit e
Izidor Hafner Successive Differences of Sequences
George Beck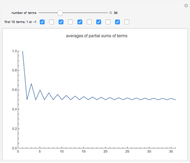 Cesàro Sums of Some Unit Sequences
George Beck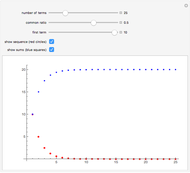 Plot of a Geometric Sequence and Its Partial Sums
Aaron Dunigan AtLee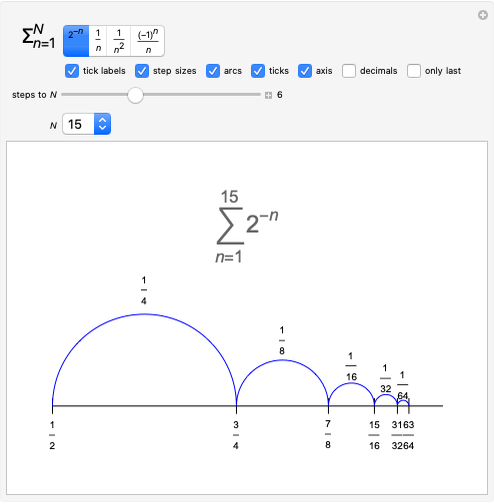 Series: Steps on a Number Line
Abby Brown and MathematiClub (Torrey Pines High School) Uniform Convergence of a Sequence of Functions
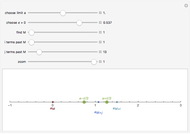 A Convergent Sequence Satisfies the Cauchy Criterion
Izidor Hafner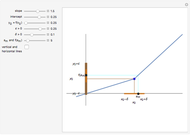 Mapping a Convergent Sequence by a Continuous Function
Izidor Hafner
-
 Different Perspectives on the Median of a Distribution
Alexander White -
 Different Perspectives on Achieving the Mean of a Distribution
Alexander White -
 From the Tether Problem to the Involute of a Circle
Alexander White -
 Examples of Limits of Real Sequences
Alexander White -
 Mayan Pyramid
Alexander White