Different Perspectives on Achieving the Mean of a Distribution


Requires a Wolfram Notebook System
Interact on desktop, mobile and cloud with the free Wolfram Player or other Wolfram Language products.
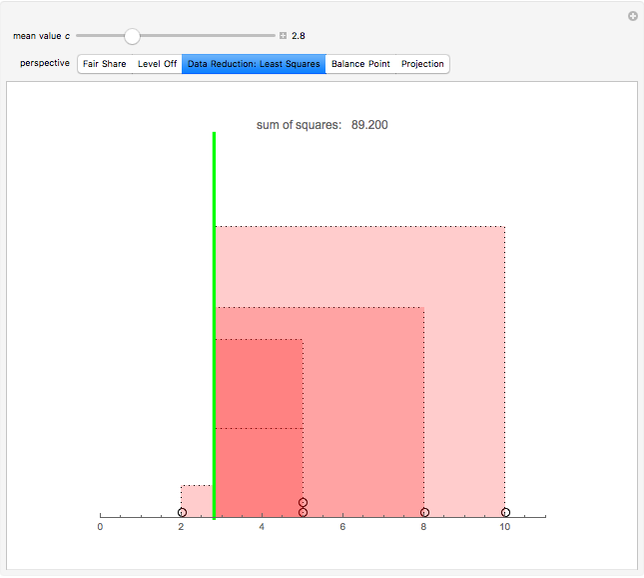
Using a small dataset  , we can determine the mean value corresponding to five different perspectives on an equitable distribution. Within each perspective, use the slider to accomplish the desired goal.
Contributed by: Alexander White, Matthew Straughn, and Layla Guyot (July 2016)
Open content licensed under CC BY-NC-SA
Snapshots


Details
For each perspective, the choice of  achieves a particular goal. By sliding the control for
  , you can explore different properties of the mean.
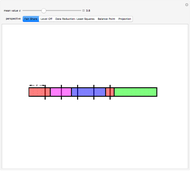
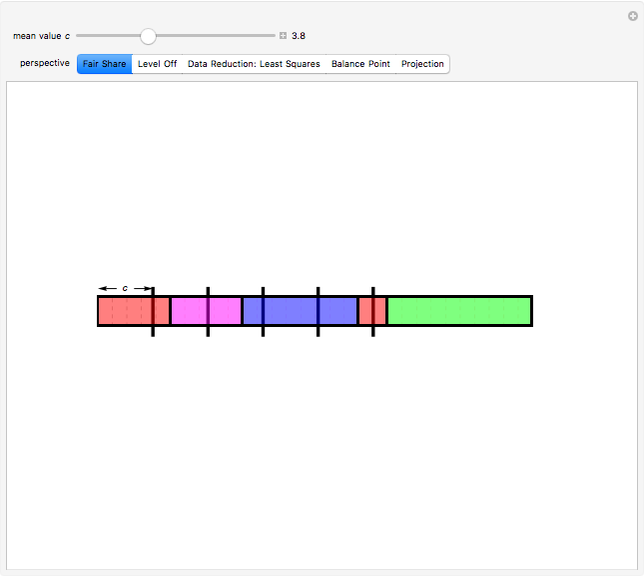
Snapshot 1: Colored bars represent data values. Choose to divide the total into equal parts to show that the mean represents a "fair share."
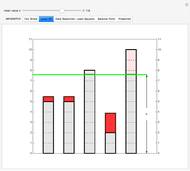
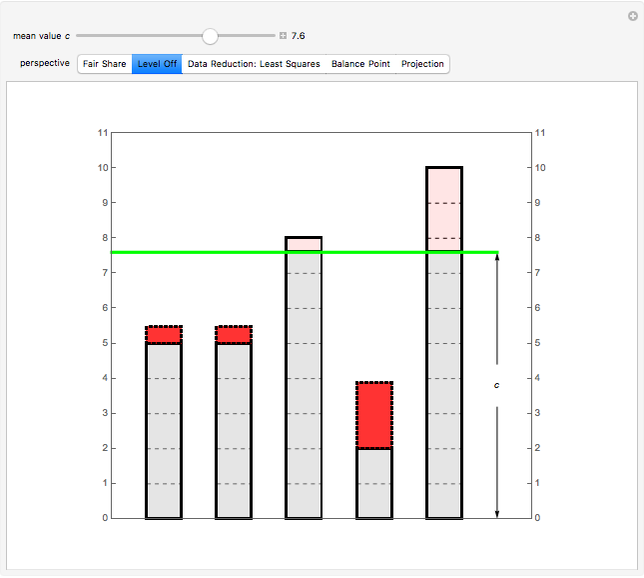
Snapshot 2: Towers represent data values. By varying , remove area from the taller bars and add it to the shorter bars. Choose so that all the bars are leveled off at the same height.
Snapshot 3: Circles on the number line represent data values. Each square represents the squared distance from an observation to . Choose to minimize the sum of the areas of the squares.
Snapshot 4: Circles with unit mass on the "teeter-totter" number line represent data values. The position of the fulcrum is given by . Choose to achieve balance.
Permanent Citation
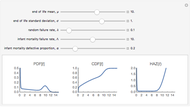 Closed-Form Full Life Cycle Distribution
Kelly S. Lowder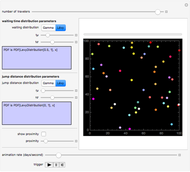 Travel with Waiting Time and Distance Distributions
Seth J. Chandler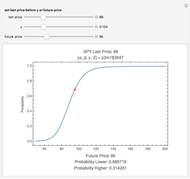 Stock Price Probability with Stable Distributions
Bob Rimmer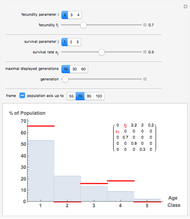 Age Distributions from a Leslie Model for Age-Structured Populations
J. Ackermann and H. Hogreve Omitted Variable Bias
Alrik Thiem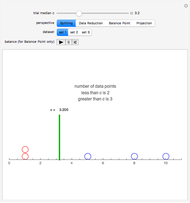 Different Perspectives on the Median of a Distribution
Alexander White and Lawrence M. Lesser Benford's Law and Data Spread
Stan Wagon (Macalester College)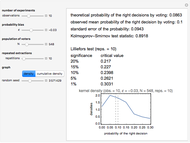 Kernel Density Estimations: Condorcet's Jury Theorem, Part 5
Tetsuya Saito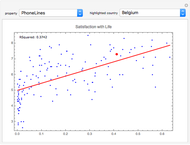 World Happiness
Erik Mahieu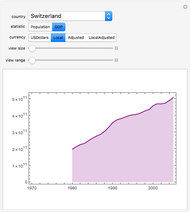 Country Statistics over Time
Alan Joyce