Expanded Fermi Solution for Estimating a Complaint's Probability


Requires a Wolfram Notebook System
Interact on desktop, mobile and cloud with the free Wolfram Player or other Wolfram Language products.
This Demonstration estimates the probability that a dissatisfied consumer files a complaint about a faulty manufactured product. It uses the expanded Fermi solution as the method of calculation. It is based on dividing the number of complaints by the assumed number,  , of units produced or still unconsumed and by a set of successive probabilities,
  to
to  . These are, for example, the probability that spoilage or failure has occurred, that it has been discovered by the consumer, etc. All these factors are specified by their estimated upper and lower limits and are used to calculate the best estimate of the complaint probability analytically and by Monte Carlo simulation.
Contributed by: Mark D. Normand, Micha Peleg, and Joseph Horowitz (March 2011)
Open content licensed under CC BY-NC-SA
Snapshots


Details
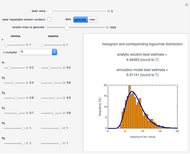
Snapshot 1: high complaint probability with four contributing factors
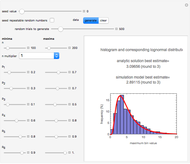
Snapshot 2: low complaint probability with four contributing factors
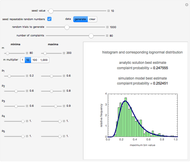
Snapshot 3: high complaint probability with six contributing factors
Snapshot 4: low complaint probability with six contributing factors
In the "standard Fermi solution", one multiplies guesses of several factors to reach an estimate. In the expanded version, ranges of the factors are entered instead of their values. The factors are: the number,  , of received complaints, entered by a slider; the lower and upper bounds of the number of units produced or still in existence,
  to
to  , set with sliders and a dropdown menu; and the lower and upper bounds of five probabilities (
 from 1 to 5) specified by
  and
and  also set with sliders.
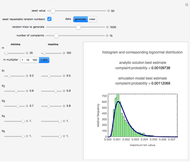
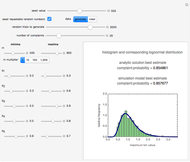
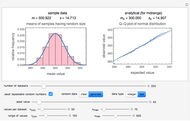
Monte Carlo simulations are done to determine the complaint probability for a random combination of the factors within their respective ranges as explained in [2]. This can be done with or without a seed. Check the "seed repeatable random numbers" box to generate a repeatable random sequence from the seed selected using the "seed value" slider. The number of repeated trials is entered using the "random trials to generate" slider. The program generates a new dataset whenever the value of any control other than the clear button is altered. For a new random dataset at the current control settings, click "clear" followed by "generate". In case the number of units produced or still in existence is known exactly, set equal to . For scenarios involving fewer than five  probabilities, set the unused probabilities' minimum and maximum values to 1. This will eliminate their contribution to the calculated probabilities' estimates. The panel shows the program controls at their current settings, a histogram of the complaint probability estimates computed in the repeated trials, and the lognormal distribution having the same logarithmic mean and standard deviation as the generated estimates depicted as a solid blue curve. Explanation of the lognormal distribution emergence can be found in [2]. The plot title's text includes the analytic solution "best estimate" and the one derived from the lognormal distribution's mode. Estimates for and outside their sliders' allowed range of 1 to 1000 can be obtained by setting the " multiplier" setter bar to the appropriate factor. Notice that if all six factors' (i.e., and the five 's) minimum and maximum values are the same, the program will render the conventional Fermi solution plotted as a spike. Also, if all but one of the six factors' minimum and maximum values are the same, then the program will generate random estimates with a uniform distribution. In that case, although the program will still generate a corresponding lognormal distribution curve, it may no longer be representative.
If the entered number of complaints, , exceeds the maximum allowed by the current settings of the factors, the corresponding calculated best estimated complaint probability  ) will appear in red. At that point will be automatically reduced until
  . If the automatically adjusted still results in
  ,
,  will remain red. Since a best estimate indicates more than one complaint per unit, its value should be ignored.
This Demonstration may also be used to estimate any of the other five probability values if the complaint's probability is known or if its upper and lower limits can be estimated.
References:
[1] H. C. von Baeyer, The Fermi Solution: Reflections on the Meaning of Physics, London: Penguin, 1993.
[2] M. Peleg, M. D. Normand, J. Horowitz, and M. G. Corradini, "An Expanded Fermi Solution for Microbial Risk Assessment," International Journal of Food Microbiology, 113(1), 2007 pp. 92–101.
Permanent Citation
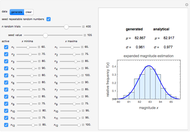 Expanded Magnitude Estimation Method
Mark D. Normand and Micha Peleg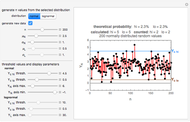 Failure Probabilities from Quality Control Charts
Mark D. Normand and Micha Peleg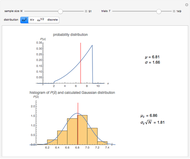 Central Limit Theorem Illustrated with Four Probability Distributions
D. Meliga and S. Z. Lavagnino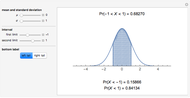 Finding Probabilities for Intervals of a Normal Distribution
Juan D. Montoro-Pons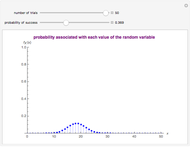 Binomial Probability Distribution
Paul Savory (University of Nebraska ? Lincoln)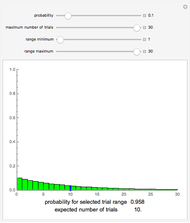 Probability in a Geometric Distribution
Daniel Tokarz Total Probability and Bayes's Theorem
Izidor Hafner Probability in a Communication Channel
Daniel de Souza Carvalho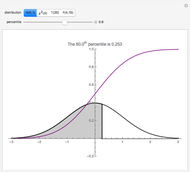 Percentiles of Certain Probability Distributions
Chris Boucher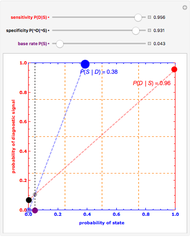 Bayes's Theorem and Inverse Probability
John Fountain
-
 Expanded Fermi Solution to Retrodict the Initial from the Final Number in a Stochastic Process
Joseph Horowitz -
 Expanded Fermi Solution for Risk Assessment
Joseph Horowitz -
 Distribution of the Means of Samples Having Random Sizes
Joseph Horowitz -
 Expanded Fermi Solution for Estimating a Complaint's Probability
Joseph Horowitz