Modular Interference Diagrams


Requires a Wolfram Notebook System
Interact on desktop, mobile and cloud with the free Wolfram Player or other Wolfram Language products.
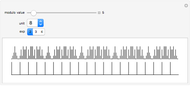
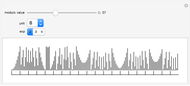
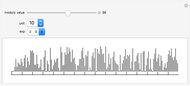
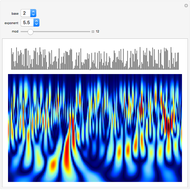
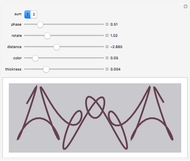
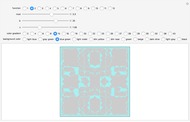
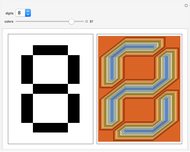
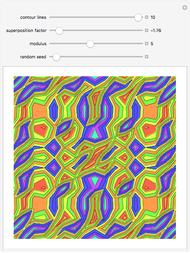
These bar charts illustrate interference, the consequence of the interaction between modular graphics and the grid of the screen. The grid serves as a sieve that selects singular values from the continuous function and eliminates the parts between.
[more]
Contributed by: Herbert W. Franke (March 2011)
Open content licensed under CC BY-NC-SA
Snapshots


Details
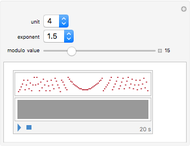
In the diagrams, you often see periodic sequences. So it is natural to try an implementation in tones instead of the visualization (see Demonstration in Related Links).
Permanent Citation
"Modular Interference Diagrams"
http://demonstrations.wolfram.com/ModularInterferenceDiagrams/
Wolfram Demonstrations Project
Published: March 7 2011
 Modular Music
Herbert W. Franke Music Box with Rotating Ballerina
Ling Jing and Marci Rosenberg Beat Frequency of Sound Waves
Christopher Engberg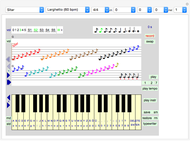 Keyboard and Composer
Karl Scherer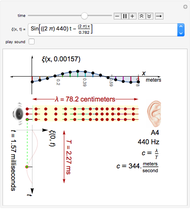 Properties of Acoustic Plane Waves
José Luis Gómez-Muñoz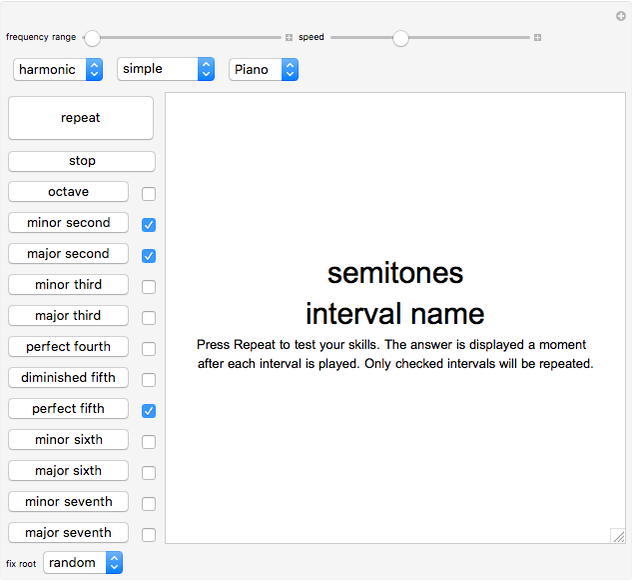 Musical Interval (Relative Pitch) Test
Jake Foster Accidentals, on Purpose
John Kiehl MathSynth
Derek Morris Simple Manipulation of Pachelbel's Canon in D
Kaetlin Taylor and Michael Todd Recognizing Chords
Marc Brodie (Wheeling Jesuit University)
-
 Painting with Wavelets
Herbert W. Franke -
 Epicycloidal Ornaments
Herbert W. Franke -
 Between Ellipsoid and Spindle in Stereo
Herbert W. Franke -
 Parametric Snowflake Design
Herbert W. Franke -
 Designs for Ribbons and Friezes Based on Trigonometric Functions
Herbert W. Franke -
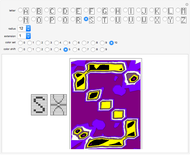
 Intarsia Patterns with Modular Graphics
Herbert W. Franke -
 Ornamental Parametric Figures
Herbert W. Franke -
 Potential Field of Two Charges
Herbert W. Franke -
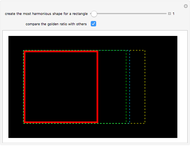 Is the Golden Ratio Really the Most Beautiful Proportion?
Herbert W. Franke -
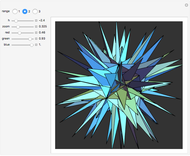 Octahedron Stars
Herbert W. Franke -
 Design of Alphabets with Fourier Transforms
Herbert W. Franke -
 Pattern Generator with Fourier Transforms
Herbert W. Franke -
 Visualization Tools for the Design of Digits
Herbert W. Franke -
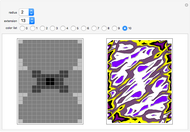
 Generating Patterns Similar to Peruvian Textiles
Herbert W. Franke -
 Stereo View without Glasses
Herbert W. Franke -
 Signs in Space
Herbert W. Franke -
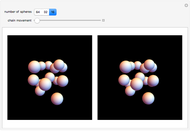 Moving Pearl Chains in 3D
Herbert W. Franke -
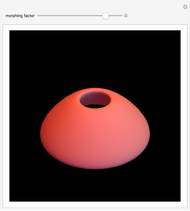 Between Sphere and Torus
Herbert W. Franke -
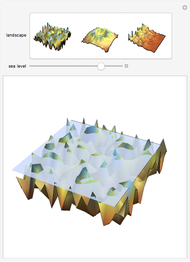 Changing Sea Levels
Herbert W. Franke -
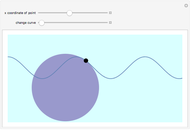 Circle of Curvature
Herbert W. Franke