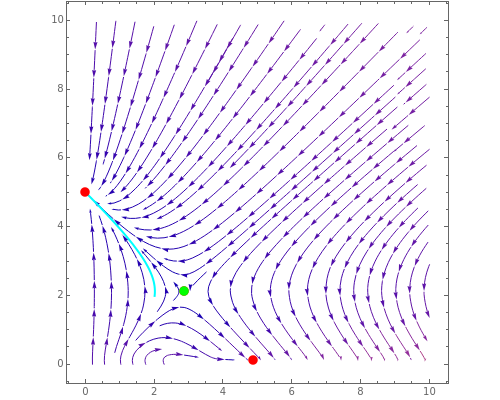
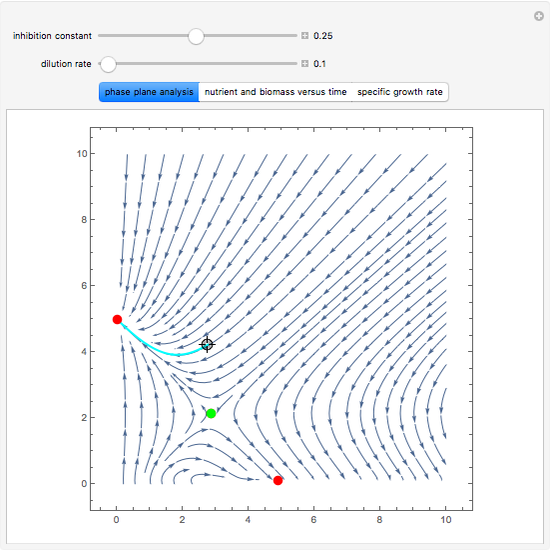
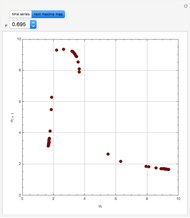
Multiple Steady States in Continuous Culture with Substrate Inhibition


Requires a Wolfram Notebook System
Interact on desktop, mobile and cloud with the free Wolfram Player or other Wolfram Language products.
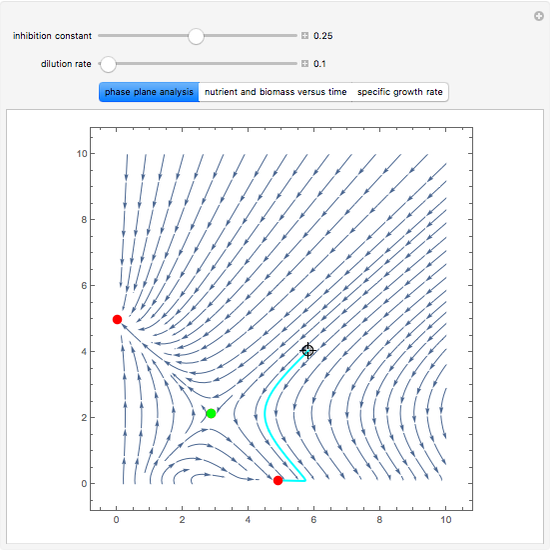
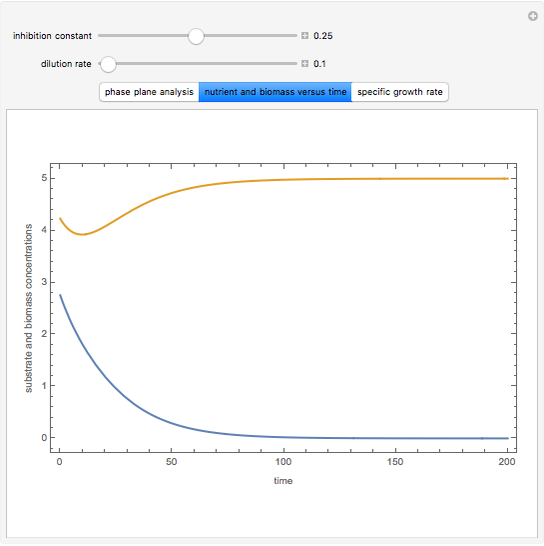
The dynamic behavior of a chemostat can be described with the following system of ordinary differential equations:

 ,
where
,
where  is the dilution rate in
  ,
,  is the biomass concentration in g/l,
  is the substrate concentration in g/l,
  is the feed substrate concentration,
  is the yield, and
  is the specific growth rate (where
  is the half-saturation constant,
  is the inhibition constant, and
  is the maximum value of the specific growth rate, with
  here).


Contributed by: Housam Binous (March 2011)
Open content licensed under CC BY-NC-SA
Snapshots

Details
I. J. Dunn, E. Heinzle, J. Ingham, and J. E. Prenosil, Biological Reaction Engineering: Dynamic Modelling Fundamentals with Simulation Examples, 2nd ed., Weinheim: Wiley-VCH, 2003.
Permanent Citation
 Steady-States of a Nonlinear Chemical System Using the Arc Length Continuation Method
Housam Binous and Brian G. Higgins Steady-State Distillation of a Quaternary Mixture
Housam Binous and Naim Faqir Steady State of an Extractive Distillation Column
Housam Binous and Naim Faqir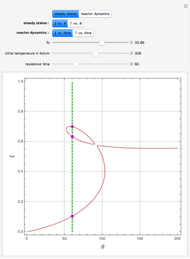 Stationary States in a Nonisothermal Continuous Stirred-Tank Reactor
Brian G. Higgins and Housam Binous Simulation of a Steady-State Binary Distillation Column
Housam Binous Simulation of a Steady-State Ternary Distillation Column
Housam Binous Rigorous Steady-State Simulation of a Multicomponent Distillation Column
Housam Binous and Zakia Nasri Steady-State Distillation of a Methanol-Water Mixture
Housam Binous and Naim Faqir Enzymatic Reactor with Product Inhibition
Housam Binous Action of a Continuous Stirred-Tank Reactor
Housam Binous and Ahmed Bellagi
-
 Liquid-Liquid Equilibrium for the 1-Butanol-Water System
Housam Binous -
 Temperature Dependence of Dehydrogenation of Ethyl Benzene to Styrene
Housam Binous -
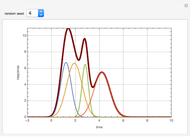 Deconvolution of a Chromatogram
Housam Binous -
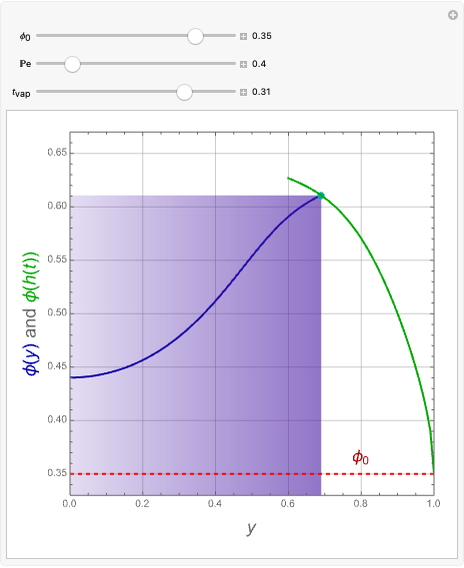 Distribution of Colloidal Particles during Solvent Evaporation
Housam Binous -
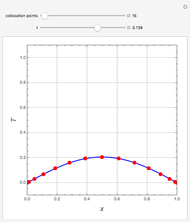 Heat Conduction in a Rod
Housam Binous -
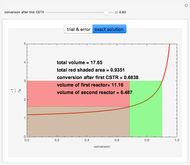 Optimal Setup of Two Continuous Stirred-Tank Reactors (CSTRs) in Series
Housam Binous -
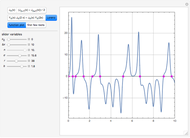
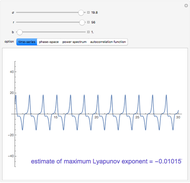 Study of the Dynamic Behavior of the Lorenz System
Housam Binous -
 A Graphically Enhanced Method for Computing Real Roots of Nonlinear Functions
Housam Binous -
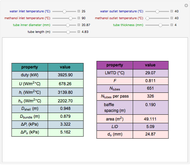 Design of a Shell and Tube Heat Exchanger
Housam Binous -
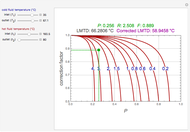 Correction Factor for Shell and Tube Heat Exchanger
Housam Binous -
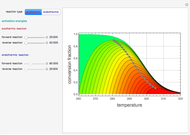 Contour Plots for Reaction Rates
Housam Binous -
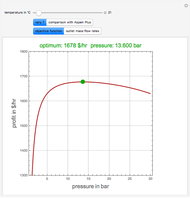 Optimal Conditions for CO2/n-Hexane Flash Separation
Housam Binous -
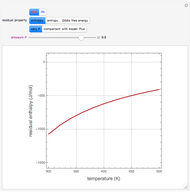 Residual Functions for the SRK and PR Equations of State
Housam Binous -
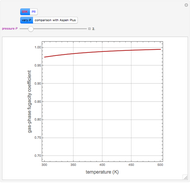 Gas-Phase Fugacity Coefficients for Propylene
Housam Binous -
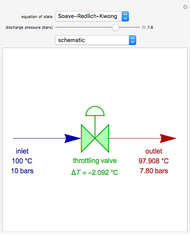 Operation of a Throttling Valve
Housam Binous -
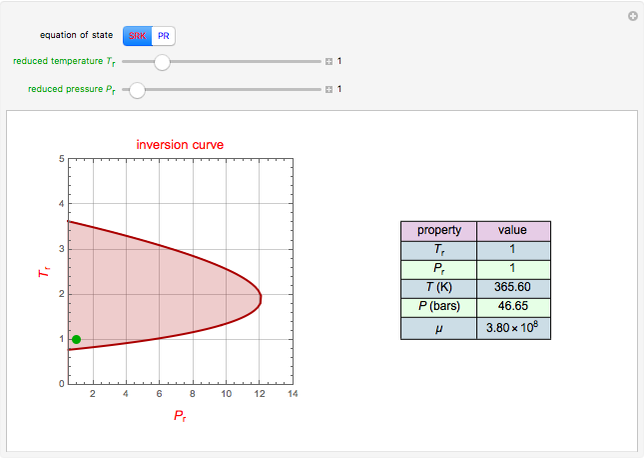 Joule-Thomson Inversion Curves for Soave-Redlich-Kwong (SRK) and Peng-Robinson (PR) Equations of State
Housam Binous -
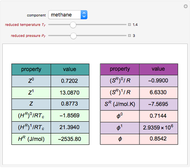 Lee-Kesler Generalized Correlations for Gases
Housam Binous -
 Mapping the Maxima for a Nonisothermal Chemical System
Housam Binous -
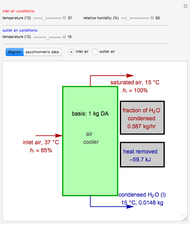 Operation of an Air Conditioner
Housam Binous -
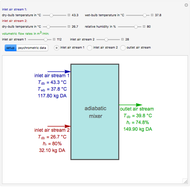 Adiabatic Mixing of Two Moist Air Streams
Housam Binous