Study of the Dynamic Behavior of the Lorenz System
Initializing live version


Requires a Wolfram Notebook System
Interact on desktop, mobile and cloud with the free Wolfram Player or other Wolfram Language products.
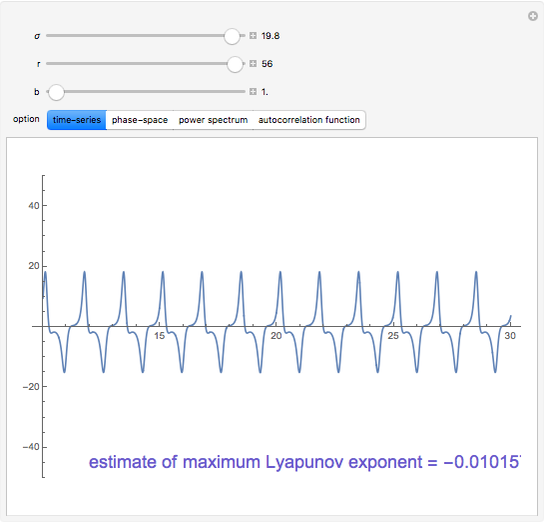
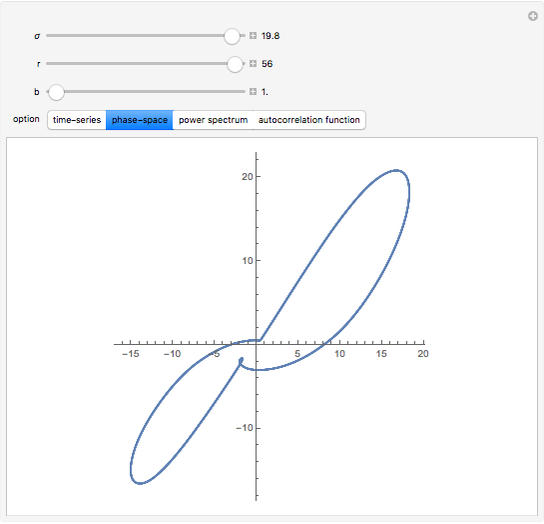
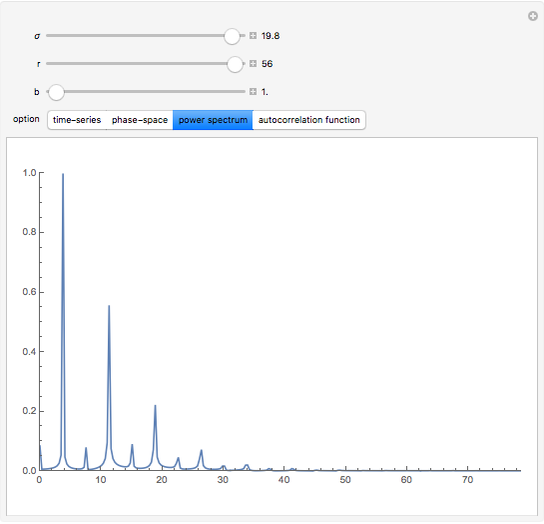
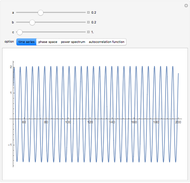
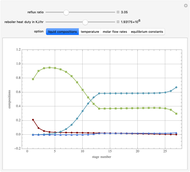
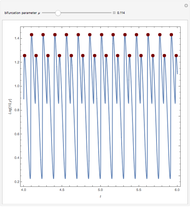
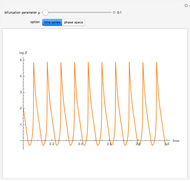
This Demonstration presents the dynamic behavior of the Lorenz system:
[more]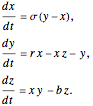


Contributed by: Housam Binous and Zakia Nasri (March 2008)
Open content licensed under CC BY-NC-SA
Snapshots
Details
Permanent Citation
Related Demonstrations
More by Author
 Study of the Dynamic Behavior of the Rossler System
Housam Binous and Zakia Nasri Dynamical Behavior of a Duffing Oscillator
Satya Mohapatra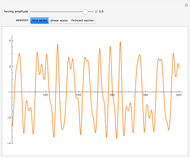 Duffing Oscillator
Housam Binous and Nasri Zakia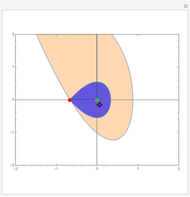 Asymptotic Stability of Dynamical System by Lyapunov's Direct Method
Housam Binous and Ahmed Bellagi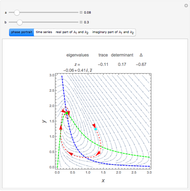 Hopf Bifurcations in a Nonlinear Two-Dimensional Autonomous System
Housam Binous, Ahmed Bellagi, and Brian G. Higgins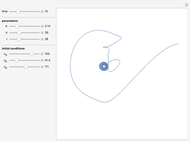 Lorenz Attractor
Rob Morris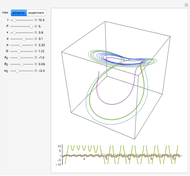 Lorenz's Water Wheel
Enrique Zeleny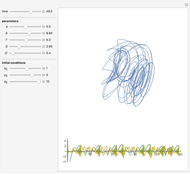 Lorenz's Model of Global Atmospheric Circulation
Enrique Zeleny KAM Tori Reforming
Marco Frasca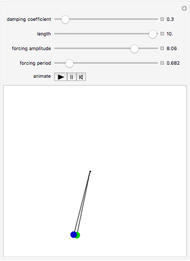 Forced Pendulums with Damping
Rob Morris
-
 Study of the Dynamic Behavior of the Lorenz System
Zakia Nasri -
 Rigorous Steady-State Simulation of a Multicomponent Distillation Column
Zakia Nasri -
 Bifurcation Diagram for the Three-Variable Autocatalator
Zakia Nasri -
 A Study of the Dynamic Behavior of a Three-Variable Autocatalator
Zakia Nasri -
Study of the Dynamic Behavior of the Rossler System
Zakia Nasri -
 Dynamic Behavior of a Nonisothermal Chemical System
Zakia Nasri