SIR Epidemic Dynamics

Requires a Wolfram Notebook System
Interact on desktop, mobile and cloud with the free Wolfram Player or other Wolfram Language products.
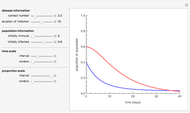
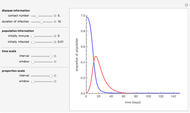
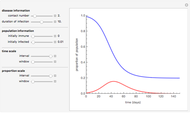
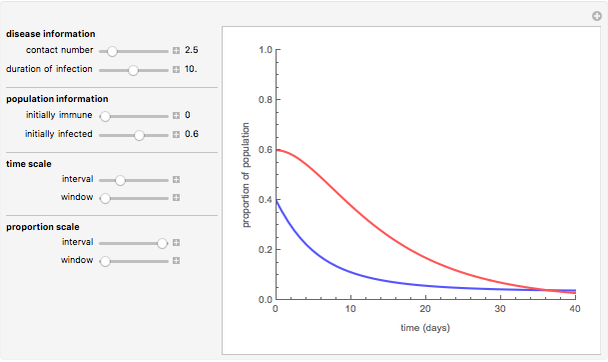
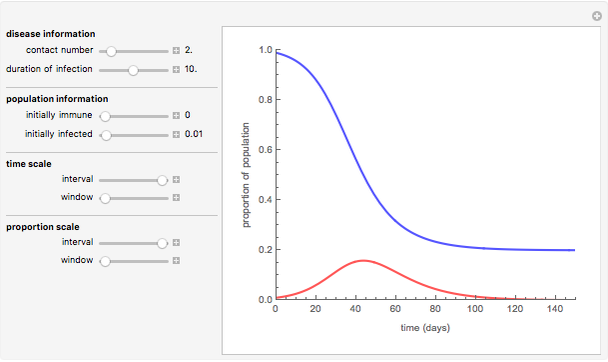
The SIR model of disease spread through a population can be investigated for different values of important disease characteristics, such as contact number and disease duration. The proportion of the population susceptible to infection (blue line) and actively infected (red line) are shown over the course of a disease's spread through the population. The initially infected fraction of the population and the initial fraction who are immune can be manipulated to see the effect on disease dynamics in the population.
Contributed by: Steve Strain (Department of Biology, Slippery Rock University of Pennsylvania) (March 2011)
Suggested by: Keith Stroyan
Open content licensed under CC BY-NC-SA
Snapshots

Details
This Demonstration was developed for a non-majors introductory course in medical microbiology where there is a need to discuss basic epidemiological principles. In this section, I would like to explore some of the ways that Mathematica can be used to advantage in making mathematically based information accessible to students possessing varying levels of mathematical skills.
Like many processes associated with living organisms, the spread of a disease caused by a microorganism through a population can be modeled mathematically using differential equations. Although numerous models of varying complexity have been developed to describe the dynamics of disease spread in a population, the SIR model presented here combines relative simplicity with good modeling of diseases that are spread from person-to-person and are familiar to students, such as measles, smallpox, and influenza.
In the SIR model, members of a population are categorized into one of three groups: those who are susceptible to being infected, those who have been infected and are able to spread the disease to susceptible individuals, and those who have recovered from the disease and are immune to subsequent re-infection. Movement of individuals is one-way only,  , and the two fundamental parameters of the model,
  (the daily infection rate) and
  (the recovery rate), act as rate constants that control how fast members progress into the
  and
and  groups, respectively. A composite parameter,
  , is often used and is referred to as the contact number. The SIR model is described by the differential equations

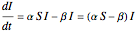 .
.
 and refer to the fraction of the population in the susceptible and infected groups, respectively. When initial conditions for these groups are specified, the change in size of these groups may be plotted over time.
For students with calculus-level math skills, careful inspection of these equations will reveal insights into the dynamics of the disease in a population. For example, if the fraction of the population in the infected group is initially increasing (i.e.,  at
at  ), an epidemic has begun. The transition between an epidemic and a non-epidemic spread of a disease thus occurs when
  , and inspection of the second equation above will quickly reveal that this transition point results when
  . Likewise, the peak of an epidemic occurs when
  and the rate of change of the infected group stops increasing and starts decreasing.
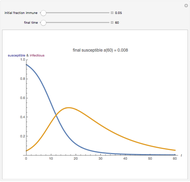
For non-major courses, however, the assumption that the students possess calculus-level skills is often not valid, and discussions of epidemic dynamics based on the mathematics behind the SIR model are not only less effective, but may be counterproductive. This does not mean that these students should not be exposed to the dynamics of disease spread. An approach that de-emphasizes the mathematics and instead focuses on the practical aspects of disease spread is required. For example, introducing the contact number,  , to these students as one of the most important characteristics determining the dynamics of spread of a particular disease is much more useful than a discussion of the rate parameters of the model. The contact number also has an easily understood "real-world" interpretation: the average number of susceptible members of the population an infected individual spreads the disease to while that individual is in the infected group. Whether an epidemic will ensue under certain initial conditions can now be discussed in terms of the contact number, and students may reasonably be expected to empirically determine that the transition between epidemic and non-epidemic states occurs when the initial fraction of the population in the susceptible group is equal to the reciprocal of the contact number (Snapshot 1). The recovery rate, , can be also be indirectly introduced as the more accessible duration of the disease
  .
.
By discussing epidemic dynamics in terms of these more easily understandable parameters and allowing Mathematica to convert to the actual model parameters behind the scenes, it is possible for discussions of an important topic to be tailored to the student audience. The dynamic nature of the output also facilitates discussions of the effect of different parameters on the nature of disease spread in a population without necessarily resorting to the equations governing the model. In particular, the importance of contact number (Snapshots 2 and 3) and the effect of artificially moving members of the population directly from the susceptible group to the recovered (and therefore immune) group through immunizations (Snapshot 4) can be easily investigated by manipulating the appropriate sliders.
Permanent Citation
 Herd Immunity for Smallpox
Keith Stroyan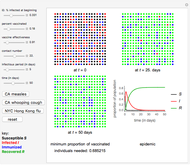 Vaccinations and Herd Immunity Using the SIR Disease Epidemic Model
Tara Nenninger and Soumyaa Mazumder Spatio-Temporal Epidemic Spread
Jan Baetens Dynamical Network Design for Controlling Virus Spread
Mengran Xue, Yan Wan, Sandip Roy, and Ali Saberi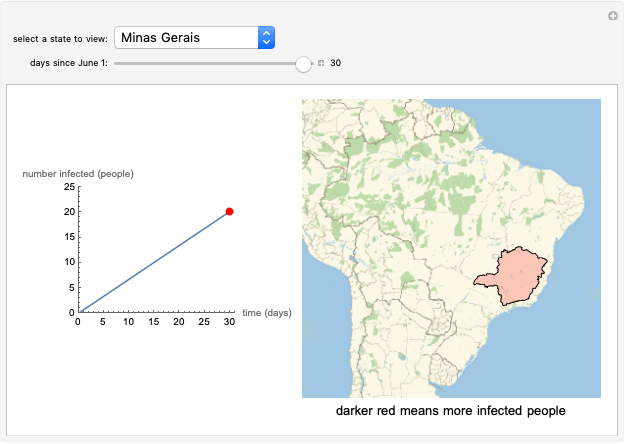 Spread of Zika in Brazil Using the Ross-MacDonald Model
Jessica Lu and John Kwak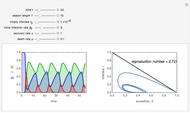 Dynamics of Seasonal Epidemics
Clay Gruesbeck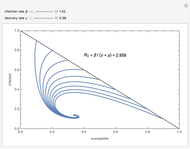 Simple Dynamics of Epidemics, the Reproduction Number
Clay Gruesbeck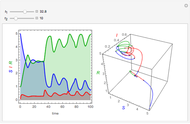 Kermack-McKendrick Epidemic Model with Time Delay
Clay Gruesbeck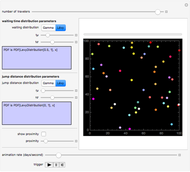 Travel with Waiting Time and Distance Distributions
Seth J. Chandler Modeling Disease Dispersion across Two Cities
Arjun Adhia