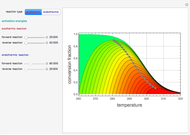
Spectral Distribution of Total Energy Emitted by a Black Body versus Temperature
Initializing live version


Requires a Wolfram Notebook System
Interact on desktop, mobile and cloud with the free Wolfram Player or other Wolfram Language products.
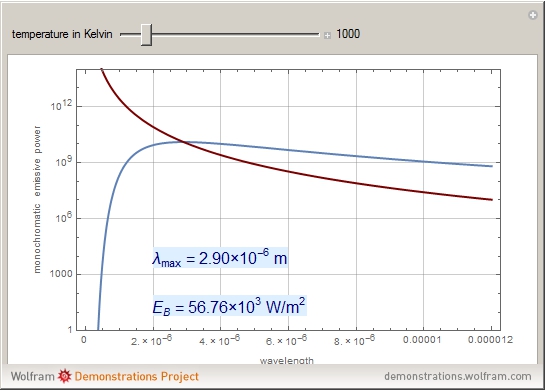
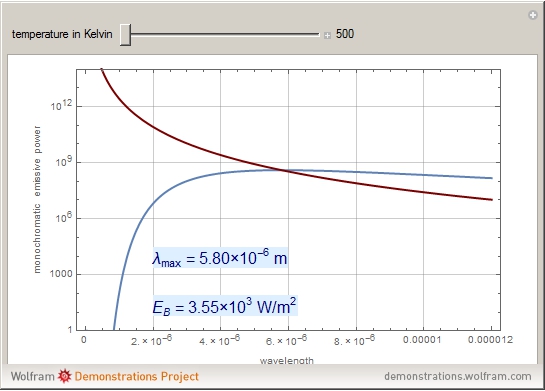
This Demonstration plots the monochromatic emissive power of a black body in  at user-set values of the temperature (blue curve). The locus of the maximum values of the monochromatic emissive power (red curve) is given by Wien's displacement law:


Contributed by: Housam Binous and Ahmed Bellagi (March 2011)
Open content licensed under CC BY-NC-SA
Snapshots
Details
C. J. Geankoplis, Transport Processes and Unit Operation, 3rd ed., Englewood Cliffs: Prentice–Hall, 1993.
Permanent Citation
Related Demonstrations
More by Author
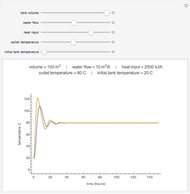 Proportional Temperature Control
Jeff Bryant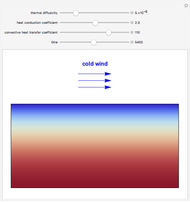 Gradient of Ground Temperature in Response to Cold Winds
Housam Binous and Ahmed Bellagi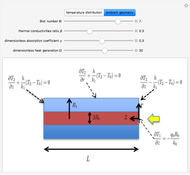 Thermal Distribution in an Optical Fiber with Heat Source
Brian G. Higgins and Housam Binous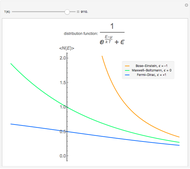 Bose-Einstein, Fermi-Dirac, and Maxwell-Boltzmann Statistics
Christian Freier (University of Technology Berlin)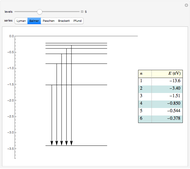 Spectral Series of the Hydrogen Atom
Enrique Zeleny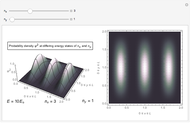 Degenerate Energy States
Douglas Kellis (Boise State University) A New Kind of Casimir Energy and Its Implications for Dark Energy
Miao Li, Xiaodong Li, and Yi Pang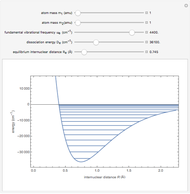 Energy Levels of a Morse Oscillator
S. M. Blinder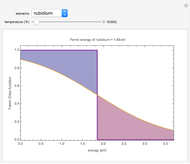 Plots of the Fermi-Dirac Distribution
Kallol Das (St. Aloysius College, Jabalpur, India)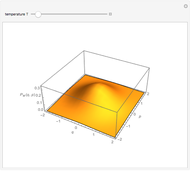 Wigner Function of a Canonical Ensemble of Harmonic Oscillators at a Given Temperature
Samira Bahrami
-
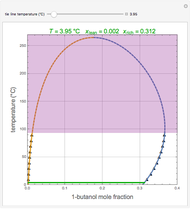 Liquid-Liquid Equilibrium for the 1-Butanol-Water System
Ahmed Bellagi -
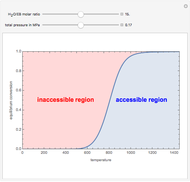 Temperature Dependence of Dehydrogenation of Ethyl Benzene to Styrene
Ahmed Bellagi -
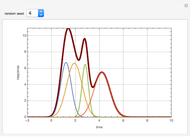 Deconvolution of a Chromatogram
Ahmed Bellagi -
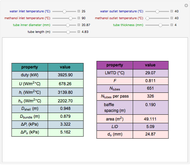 Design of a Shell and Tube Heat Exchanger
Ahmed Bellagi -
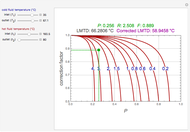 Correction Factor for Shell and Tube Heat Exchanger
Ahmed Bellagi -
 Contour Plots for Reaction Rates
Ahmed Bellagi -
 Optimal Conditions for CO2/n-Hexane Flash Separation
Ahmed Bellagi -
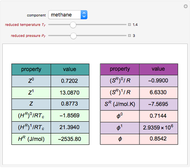
 Residual Functions for the SRK and PR Equations of State
Ahmed Bellagi -
 Gas-Phase Fugacity Coefficients for Propylene
Ahmed Bellagi -
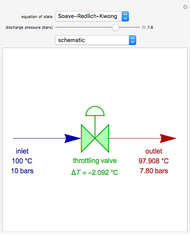 Operation of a Throttling Valve
Ahmed Bellagi -
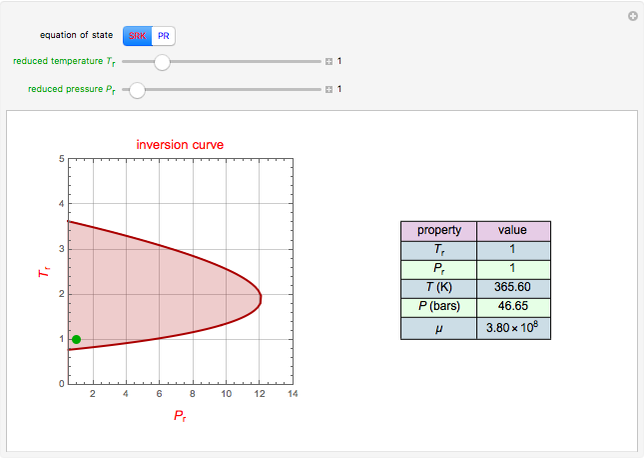 Joule-Thomson Inversion Curves for Soave-Redlich-Kwong (SRK) and Peng-Robinson (PR) Equations of State
Ahmed Bellagi -
 Lee-Kesler Generalized Correlations for Gases
Ahmed Bellagi -
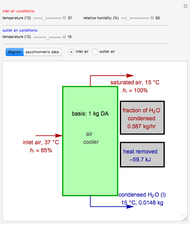 Operation of an Air Conditioner
Ahmed Bellagi -
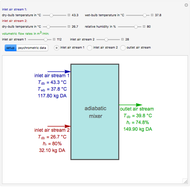 Adiabatic Mixing of Two Moist Air Streams
Ahmed Bellagi -
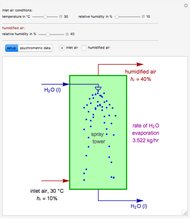 Adiabatic Humidification
Ahmed Bellagi -
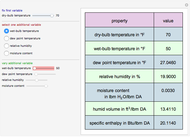 Psychrometric Data Calculator in English Engineering Units
Ahmed Bellagi -
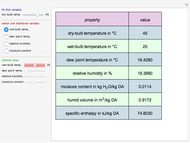 Psychrometric Data Calculator in SI Units
Ahmed Bellagi -
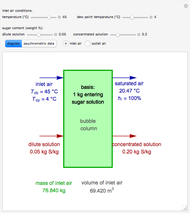 Concentration of Sugar Solution in a Bubble Column
Ahmed Bellagi -
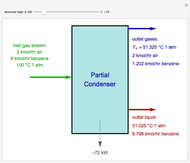 Operation of a Partial Condenser
Ahmed Bellagi -
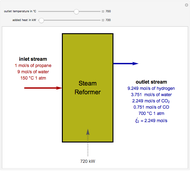 Steam Reforming of Propane
Ahmed Bellagi