Waiting for the Next Record


Requires a Wolfram Notebook System
Interact on desktop, mobile and cloud with the free Wolfram Player or other Wolfram Language products.
Consider a sequence of independent, identically distributed, continuous data values  ,
,  , …. A value
  is a record value (or a high-water mark) if it is the largest value among all the values that have been recorded up to time
  . Let
. Let  be the
  record value,
  ; define
  . Let
. Let  be the time at which the record occurred (
 ). Let
  be the inter-record waiting time, that is, the number of steps needed to get the record after the
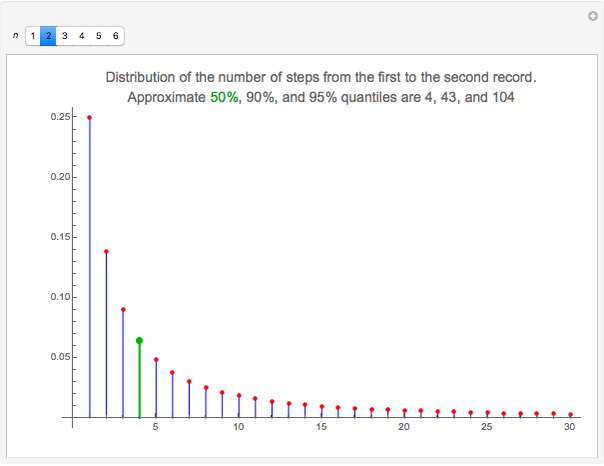
  record. This Demonstration shows the distribution of
  for
for  .
.
Contributed by: Heikki Ruskeepää (May 2014)
Open content licensed under CC BY-NC-SA
Snapshots

Details
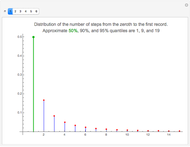
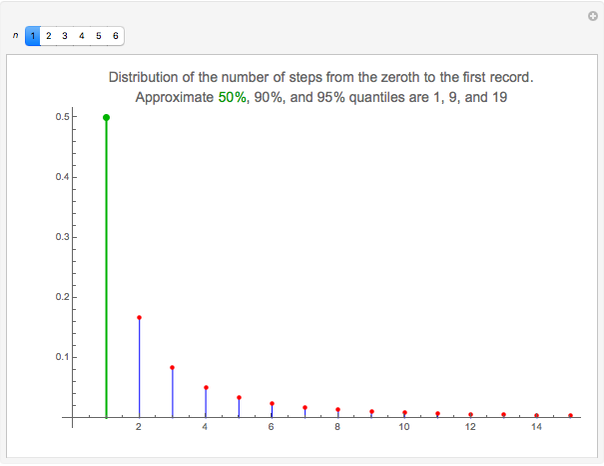
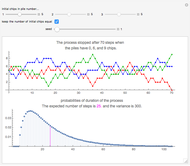
Snapshot 1: Here is the distribution of  , that is, probabilities of the number of steps needed to get the first record
  after the zeroth record . The first record appears very soon. Indeed, with a probability of
  , the first record is the next data value . (The median of the distribution is shown with a green color while the 90- and 95-percent quantiles are not shown in any special way in the figure.) With an approximate probability of 0.9, the first record is among
  , and with an approximate probability of 0.95, the first record is among
  .
.
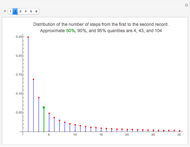
Snapshot 2: The second record, too, occurs quite soon. With a probability of  , the second record is the next data value after the first record. The approximate median is 4, that is, with an approximate probability of 0.5, the second record is among the four data values after the first record. The approximate 90- and 95-percent quantiles are 43 and 104, respectively. That is, with a probability of 0.9, the second record is among the 43 data values after the first record.
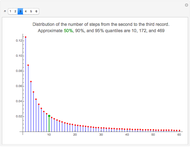
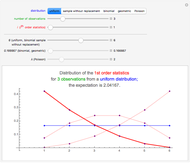
Snapshot 3: With a probability of  , the third record is the next data value after the second record. The approximate median is 10. The 90- and 95-percent quantiles are 172 and 469, respectively. Thus, to be sure, we have to reserve some time to see the third record; with a probability of 0.05, even 469 new data values after the second record do not suffice.
In the following, we summarize the 50-, 90-, and 95-percent quantiles of , ...,  :
:
: 1, 9, 19
 : 4, 43, 104
 : 10, 172, 469
 : 26, 645, 1947
 : 68, 2333, 7696
: 182, 8225, 29363
The 50-percent quantiles or medians are quite moderate. For example, with an approximate probability of 0.5 the waiting time for the sixth record is at most only 182 steps after the fifth record. However, the 90- and 95-percent quantiles show that the probability densities are, after the initial rapid decrease, very flat and decrease very slowly. For example, to see the sixth record after the fifth record with a probability of 0.95, we need 29363 new data values!
The probabilities of the inter-record waiting times are given by [1, p. 27]
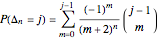 .
.
The expectation of the inter-record waiting time is infinite for all  . The 50-, 90-, and 95-percent quantiles given the Demonstration are the points at which the cumulative distribution function is at least 0.5, 0.9, or 0.95, respectively, for the first time. All the quantiles were calculated outside of the Demonstration.
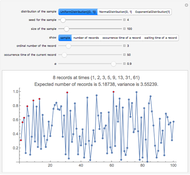
The probabilities considered here are unconditional. The conditional inter-record waiting time of the next record, conditioned on the time of the current record, is considered in the Demonstration "Records in Sequences of Random Variables". Note also that the probabilities of the inter-record waiting times do not depend on the distribution of the data.
Reference
[1] B. C. Arnold, N. Balakrishnan, and H. N. Nagaraja, Records, New York: Wiley, 1998.
Permanent Citation
 Records in Sequences of Random Variables
Heikki Ruskeepää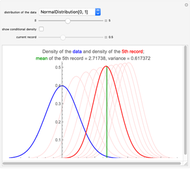 Distribution of Records
Heikki Ruskeepää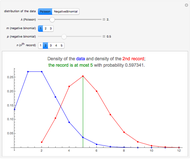 Distribution of Discrete Records
Heikki Ruskeepää Hidden Periodicity in Quality Control Records
Mark D. Normand and Micha Peleg A Reluctant Random Walk
Heikki Ruskeepää Spin Game
Heikki Ruskeepää A Curious Coin-Flipping Game
Heikki Ruskeepää Montmort's Problem
Heikki Ruskeepää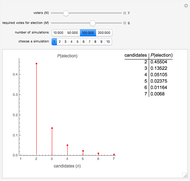 Probability of Election in a Vote
Heikki Ruskeepää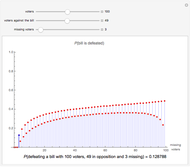 Missing Voters
Heikki Ruskeepää
-
 Obtuse Random Triangles from Three Points in a Rectangle
Heikki Ruskeepää -
 Chaotic Data: Maximal Lyapunov Exponent
Heikki Ruskeepää -
 Chaotic Data: Correlation Dimension
Heikki Ruskeepää -
 Chaotic Data: Delay Time and Embedding Dimension
Heikki Ruskeepää -
 Method of Support Vector Regression
Heikki Ruskeepää -
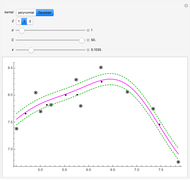
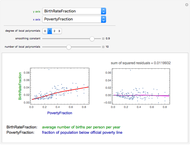 Local Regression for Country Data
Heikki Ruskeepää -
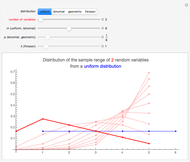
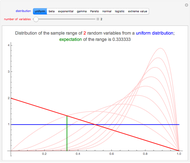 Distribution of the Sample Range of Continuous Random Variables
Heikki Ruskeepää -
 Distribution of the Sample Range of Discrete Random Variables
Heikki Ruskeepää -
 Distributions of Discrete Order Statistics
Heikki Ruskeepää -
 Distributions of Continuous Order Statistics
Heikki Ruskeepää -
 Waiting for the Next Record
Heikki Ruskeepää -
Distribution of Discrete Records
Heikki Ruskeepää -
Records in Sequences of Random Variables
Heikki Ruskeepää -
Distribution of Records
Heikki Ruskeepää -
 The Three-Tower Problem
Heikki Ruskeepää -
 Walking Randomly Until No Shoes Are Available
Heikki Ruskeepää -
A Reluctant Random Walk
Heikki Ruskeepää -
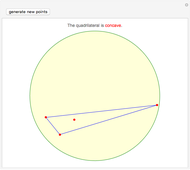 Concave Random Quadrilaterals from Four Points in a Disk
Heikki Ruskeepää -
 Obtuse Random Triangles from Three Parts of the Unit Interval
Heikki Ruskeepää -
Spin Game
Heikki Ruskeepää