Method of Support Vector Regression


Requires a Wolfram Notebook System
Interact on desktop, mobile and cloud with the free Wolfram Player or other Wolfram Language products.
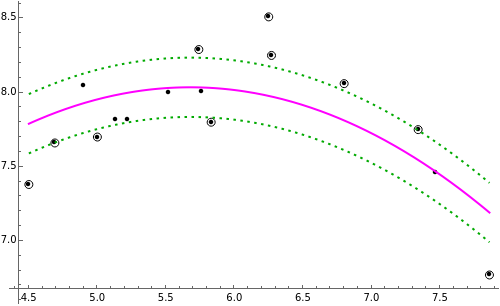
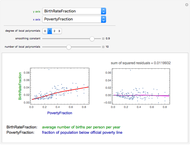
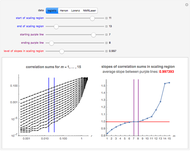
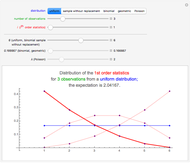
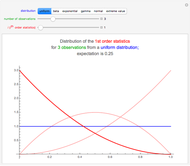
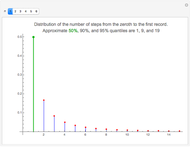
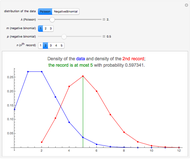
This Demonstration uses the method of support vector regression to calculate curves representing chemical data. The regression curve is shown in magenta. The margins (dashed green curves) are at distance  from the regression curve. The circled black points outside of the margins are the support vectors; the points inside the margins could be deleted and the regression curve would not change. The method of support vector regression uses kernels: here either a polynomial kernel (of degree 1, 2 or 3) or a Gaussian kernel (with parameter
  ). You can vary the parameter
  to adjust the weights given to the fitting errors from the curve to the support vectors.
Contributed by: Heikki Ruskeepää (March 2017)
Open content licensed under CC BY-NC-SA
Snapshots


Details
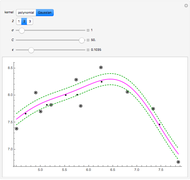
Snapshot 1: for small , most points are support vectors
Snapshot 2: for small , very little weight is given to discrepancies between the fit and the support vectors, so that the fit follows the data only approximately
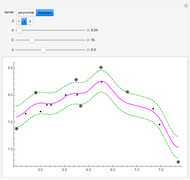
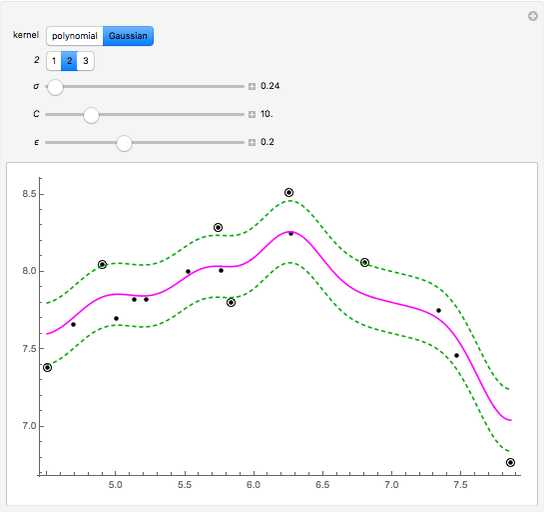
Snapshot 3: with a Gaussian kernel, a small causes the fit to follow the data very closely
Snapshot 4: with a larger , the fit follows the data less accurately
The data used in this Demonstration is from [1].
For a detailed derivation and explanation of the method of support vector regression, see the document cited in Related Links. In that document, we arranged a small competition in which we studied the performance of support vector regression and seven other prediction methods when applied to 11 datasets. Support vector regression was the winner of that competition.
Reference
[1] O. Ivanciuc, "Applications of Support Vector Machines in Chemistry," in Reviews in Computational Chemistry, Vol. 23 (K. B. Lipkowitz and T. R. Cundari, eds.), Weinheim: Wiley-VCH, 2007 pp. 291–400.
Permanent Citation
 Local Regression for Country Data
Heikki Ruskeepää Correlation and Regression Explorer
Ian McLeod (The University of Western Ontario) Spread-Location Regression Diagnostic Check
Ian McLeod Karhunen-Loeve Directions and Regression
Ian McLeod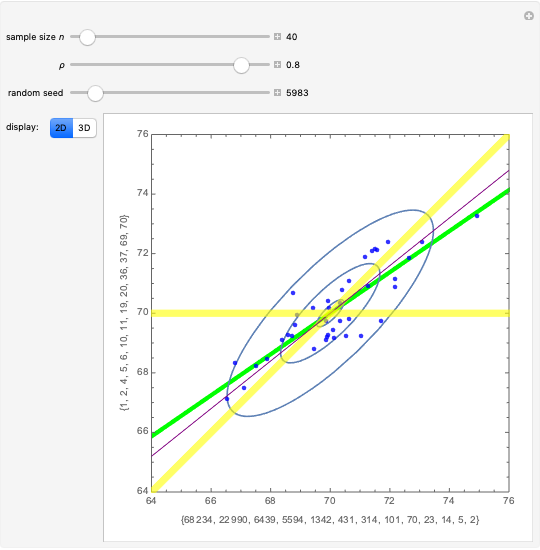 Regression toward the Mean
Ian McLeod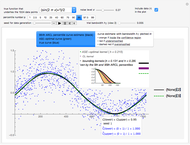 Nonparametric Regression and Kernel Smoothing: Confidence Regions for the L2-Optimal Curve Estimate
Didier A. Girard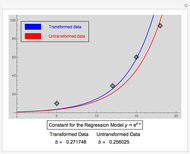 Comparing Regression Models with and without Data Transformation
Vincent Shatlock and Autar Kaw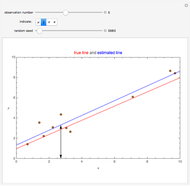 Mean, Fitted-Value, Error, and Residual in Simple Linear Regression
Ian McLeod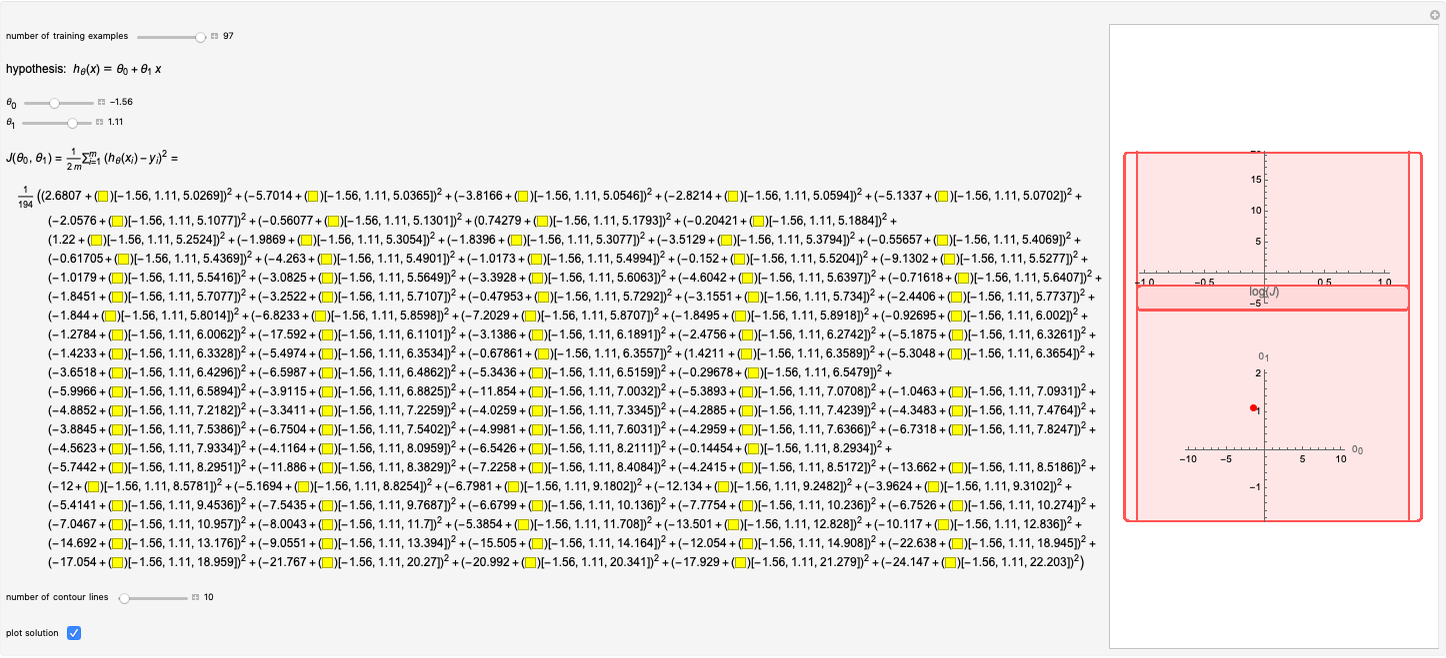 Linear Regression
Mikel Landajuela Hidden Correlation in Regression
Ian McLeod and Yun Shi
-
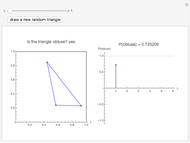 Obtuse Random Triangles from Three Points in a Rectangle
Heikki Ruskeepää -
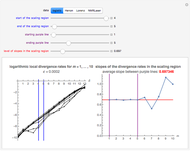 Chaotic Data: Maximal Lyapunov Exponent
Heikki Ruskeepää -
 Chaotic Data: Correlation Dimension
Heikki Ruskeepää -
 Chaotic Data: Delay Time and Embedding Dimension
Heikki Ruskeepää -
 Method of Support Vector Regression
Heikki Ruskeepää -
Local Regression for Country Data
Heikki Ruskeepää -
 Distribution of the Sample Range of Continuous Random Variables
Heikki Ruskeepää -
 Distribution of the Sample Range of Discrete Random Variables
Heikki Ruskeepää -
 Distributions of Discrete Order Statistics
Heikki Ruskeepää -
 Distributions of Continuous Order Statistics
Heikki Ruskeepää -
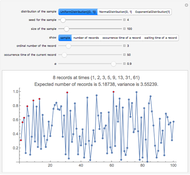
 Waiting for the Next Record
Heikki Ruskeepää -
 Distribution of Discrete Records
Heikki Ruskeepää -
 Records in Sequences of Random Variables
Heikki Ruskeepää -
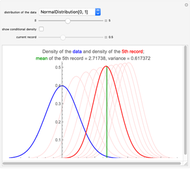 Distribution of Records
Heikki Ruskeepää -
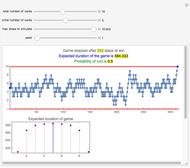
 The Three-Tower Problem
Heikki Ruskeepää -
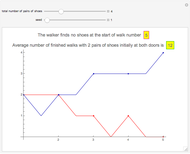 Walking Randomly Until No Shoes Are Available
Heikki Ruskeepää -
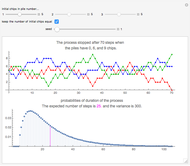
 A Reluctant Random Walk
Heikki Ruskeepää -
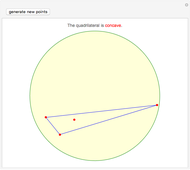 Concave Random Quadrilaterals from Four Points in a Disk
Heikki Ruskeepää -
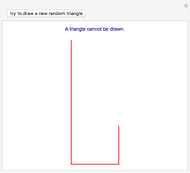 Obtuse Random Triangles from Three Parts of the Unit Interval
Heikki Ruskeepää -
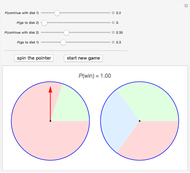 Spin Game
Heikki Ruskeepää