Orbit Diagram of the Logistic Map


Requires a Wolfram Notebook System
Interact on desktop, mobile and cloud with the free Wolfram Player or other Wolfram Language products.
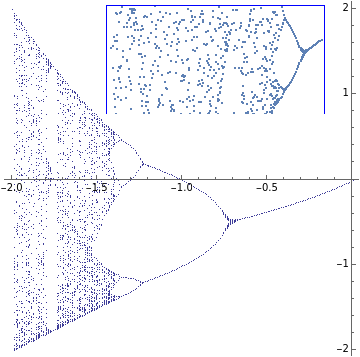
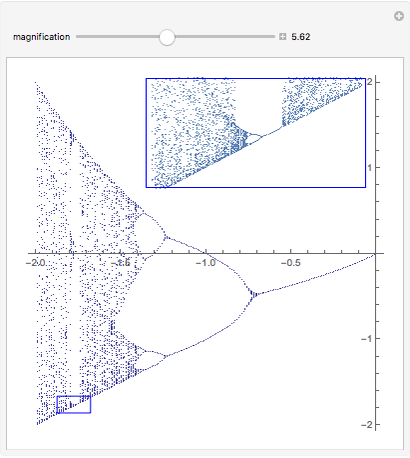
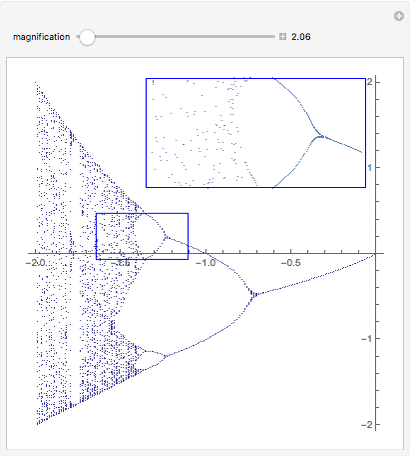
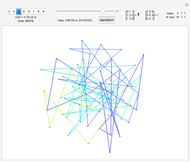
Plot the points  , where
  and the
  are the iterates of the quadratic map
  . Each
  leads to a distinct orbit; for example, for
  , the orbit is 0, -1.5, 0.75, -0.9375, …. For constant λ, the set of
  is infinite, but in this picture only a finite sample is shown. The whole plot is called the orbit diagram for the map. The set of points on the right that looks like a curve consists of stable points. In the middle the points orbit between two values. Both of these cases are examples of attractors.
Contributed by: Ed Pegg Jr (March 2011)
Open content licensed under CC BY-NC-SA
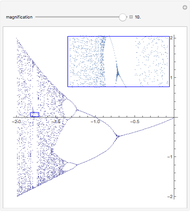
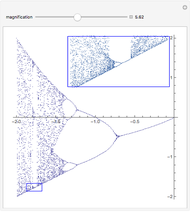
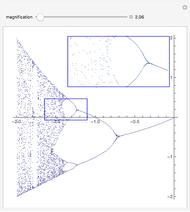
Snapshots

Details
detailSectionParagraphPermanent Citation
"Orbit Diagram of the Logistic Map"
http://demonstrations.wolfram.com/OrbitDiagramOfTheLogisticMap/
Wolfram Demonstrations Project
Published: March 7 2011
 Orbit Diagram of Two Coupled Logistic Maps
C. Pellicer-Lostao and R. Lopez-Ruiz Orbit Diagram of Two Coupled Logistic Maps with Delay
C. Pellicer-Lostao and R. Lopez-Ruiz (University of Zaragoza, Spain)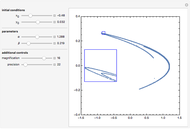 Orbit Diagram of the Hénon Map
C. Pellicer-Lostao and R. Lopez-Ruiz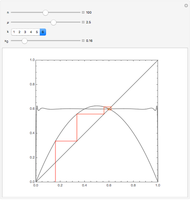 Trajectories of the Logistic Map
Michael Trott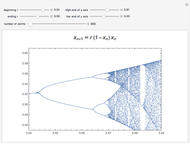 Classic Logistic Map
Robert M Lurie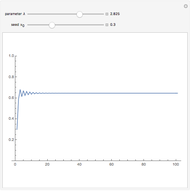 Logistic Map: Onset of Chaos
Phil Ramsden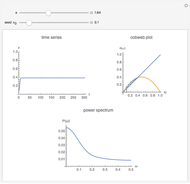 Three Views of the Logistic Map
Hiroki Sayama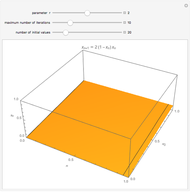 Iterates of the Logistic Map in 3D
Stephen Wolfram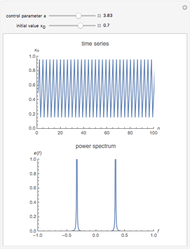 Power Spectrum of the Logistic Map
Alraune Zech, Jonathan F. Donges, Norbert Marwan, and Jürgen Kurths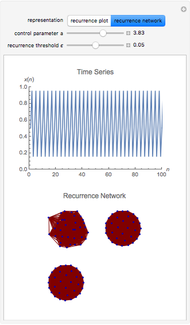 Recurrence-Based Representations of the Logistic Map
Alraune Zech, Jonathan F. Donges, Norbert Marwan, and Jürgen Kurths
-
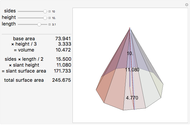 Right Pyramid Volume and Surface Area
Ed Pegg Jr -
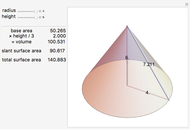 Right Cone Volume and Area
Ed Pegg Jr -
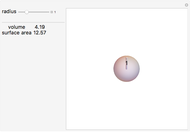
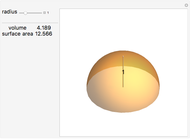 Hemisphere Volume and Surface Area
Ed Pegg Jr -
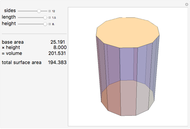
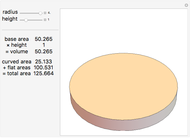 Cylinder Volume and Area
Ed Pegg Jr -
 Regular Prism Volume and Surface Area
Ed Pegg Jr -
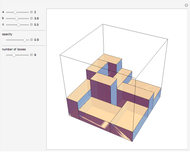
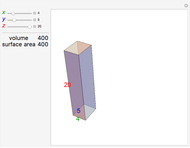 Box Volume and Surface Area
Ed Pegg Jr -
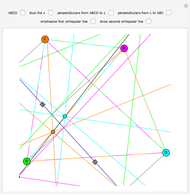 Orthopolar Lines for a Quadrilateral
Ed Pegg Jr -
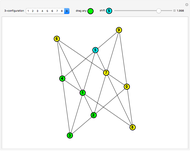 The Nine 10_3 Configurations
Ed Pegg Jr -
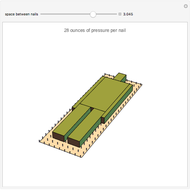 Bed of Nails
Ed Pegg Jr -
 Box Toppling Patterns
Ed Pegg Jr -
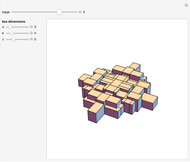
 Box Packing
Ed Pegg Jr -
 Sphere Volume and Area
Ed Pegg Jr -
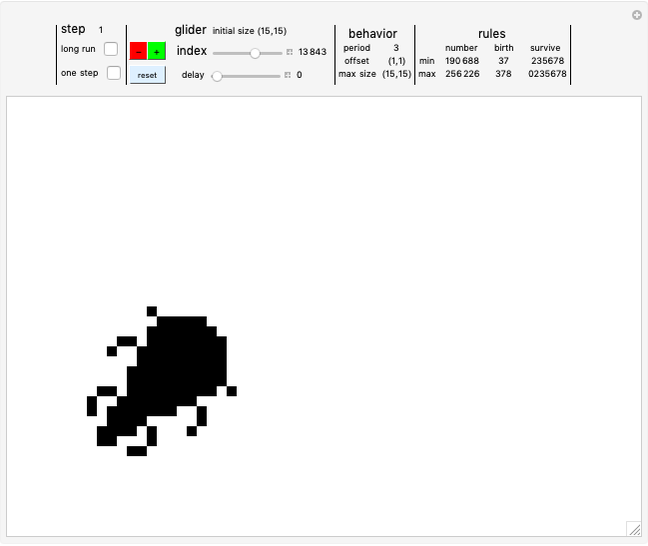 2D CA Glider Database
Ed Pegg Jr -
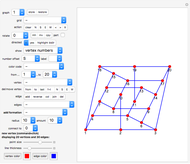 Constructing and Manipulating Graphs
Ed Pegg Jr -
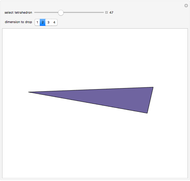 Acute Sets in Euclidean Spaces
Ed Pegg Jr -
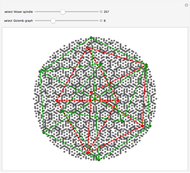 Moser Spindles, Golomb Graphs and Root 33
Ed Pegg Jr -
 GL(3,n) Acting on 3D Points
Ed Pegg Jr -
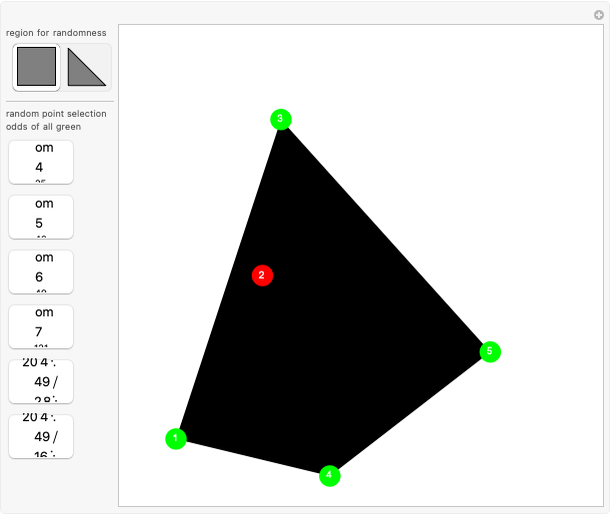 Sylvester's Four-Point Problem
Ed Pegg Jr -
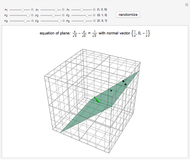 Three Points Determine a Plane
Ed Pegg Jr -
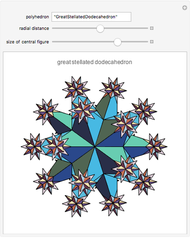 Polyhedra Copied to the Vertices of the Same Kind of Polyhedron
Ed Pegg Jr