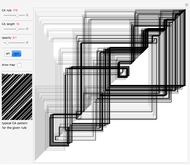
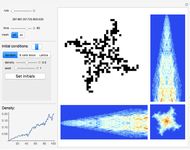
Consider finite elementary cellular automata (ECA) of size 10. All possible binary vectors of length 10 form a complete set of initial conditions (CSIC). Every step of an ECA evolution maps this set to itself, and a particular initial condition starts a trajectory in time consisting of a sequence of binary states [1]. This Demonstration uses flow diagrams to visualize the trajectories of all 1024 initial conditions over five steps of evolution of an ECA.
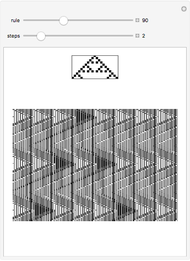
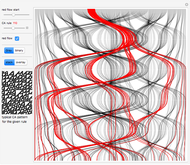
To construct a flow chart, first index all initial conditions by integers in binary or with a Gray code. After one step of the ECA evolution, each index is mapped to another index from the same set. Place the previous step indices on the top horizontal line and the next step indices on the bottom horizontal line. Then connect each index and its mapped counterpart with a spline line. The whole procedure is repeated for the five steps of the evolution of the ECA, thus giving five flow diagrams.
The diagrams can be stacked on top of each other to show the evolution of indices in time, running vertically from top to bottom. Or the diagrams can be made translucent and overlaid so the most frequent mappings will be more apparent and dense. In this case, coloring shows a clearer mapping between different index domains.
For most of the ECA rules we observe "thinning" of CSIC [1, 2], which reflects on ordering, self-organization, and the formation of a Cantor set attractor in the limit [1–5] as the ECA size tends to infinity. Set "Gray" and "stacked" to observe quick divergence of the initially narrow bundle of red trajectories [1] and their redistribution over all indices, especially for the type-3 rules. This indicates chaotic behavior [1, 3]. Gray code ordering is most useful in this case, because it makes initial conditions in the red bundle structurally close. More precisely, two neighboring initial conditions differ only by a unit Hamming distance.
Browse the bookmarks and snapshots for interesting cases. The phenomenon shown here manifests more clearly with increasing ECA size, but this takes more time to compute.
[less]


