Phase Percentage and Carbon Content Estimation in Hypoeutectoid Steels by Image Processing

Requires a Wolfram Notebook System
Interact on desktop, mobile and cloud with the free Wolfram Player or other Wolfram Language products.
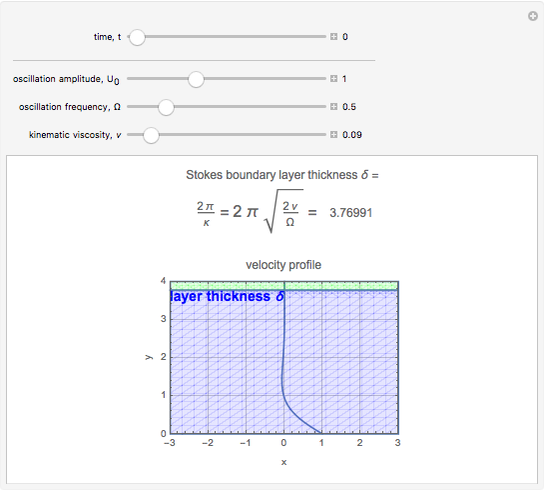
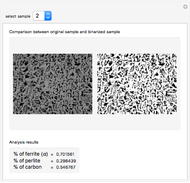
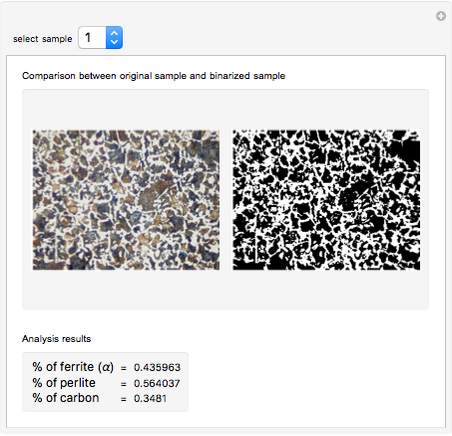
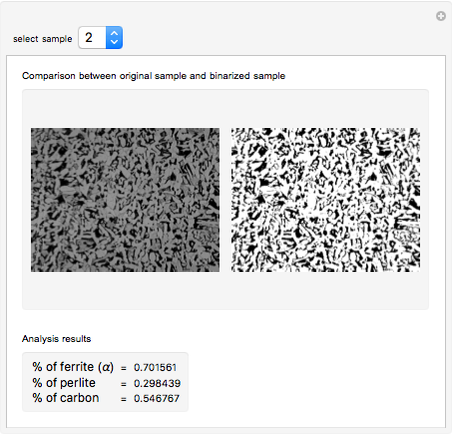
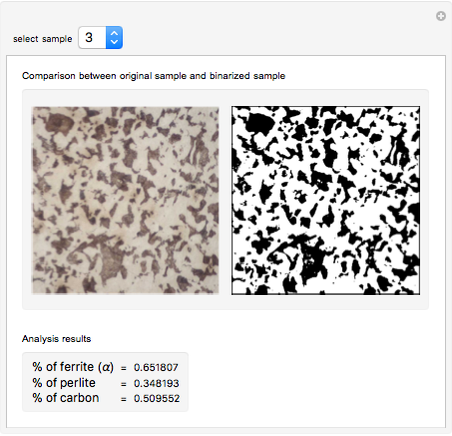
This Demonstration shows that performing image processing with Mathematica is not just easy, but extremely useful. In this case, we analyze the microstructure of two methallographic samples of hypoeutectoid steel, extracting the percentage of pearlite versus ferrite and, by applying the "lever rule", estimating the percentage of carbon in the steel alloy.
Contributed by: Jorge García Tíscar (March 2011)
Open content licensed under CC BY-NC-SA
Snapshots

Details
In materials science, and particularly in the study of steel alloys, one of the most important characteristics of a particular alloy is its microstructure. A simple look at the microstructure of a steel alloy can reveal extremely useful information about the material strength, thermal treatments it has suffered, composition, and so on.
To analyze the microstructure, a metallographical preparation must be performed to obtain a sample: three of these have been included here. In hypoeutectoid steel alloys, we see two phases in the sample: pearlite (dark) and ferrite (white). Applying a reverse "lever rule", we can obtain the carbon percentage in the alloy, a very useful indicator of the alloy properties.
This Demonstration automates the process of measuring the percentages of ferrite and pearlite in the sample, binarizing it, and then measuring the two levels (black and white) that are the percentages of the two phases. Mathematica performs this image processing (from image to phase levels) in just two short lines of code.
 Interactions between Textured Glue Particles and a Ball Based on Idealized Dynamics
Yiyang Li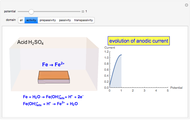 Corrosion Mechanism for Stainless Steel
Quang-Dao Trinh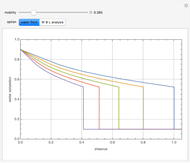 Two-Phase Fluid Flow in Porous Media
Clay Gruesbeck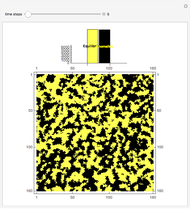 A Two-Phase Anneal: The Beauty of Interface Dynamics
Michael Dewus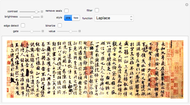 Image Processing of Calligraphy
Frederick Wu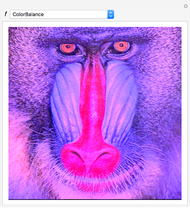 A Collection of Image Processing Functions
Enrique Zeleny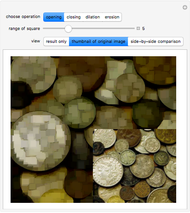 Morphological Processing
Srivani Pinneli and Yu-Sung Chang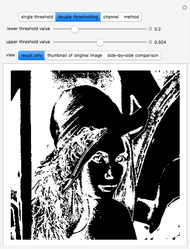 Convert an Image to Binary
Srivani Pinneli and Yu-Sung Chang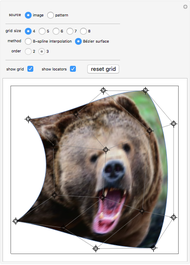 Image Warping
Yu-Sung Chang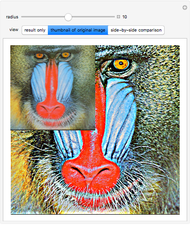 Image Sharpening
Srivani Pinneli