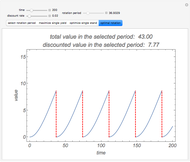
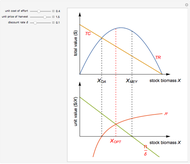
Surplus Production in Logistic Growth
Initializing live version


Requires a Wolfram Notebook System
Interact on desktop, mobile and cloud with the free Wolfram Player or other Wolfram Language products.
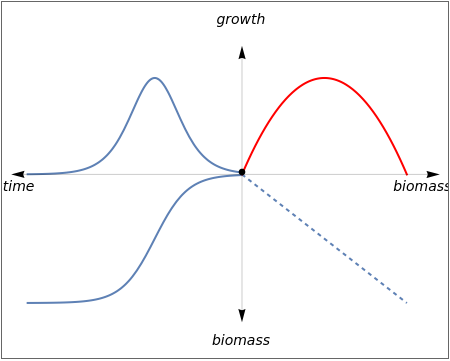
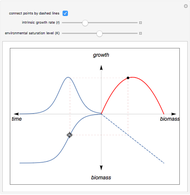
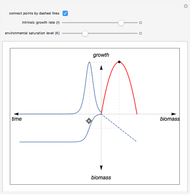
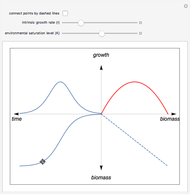
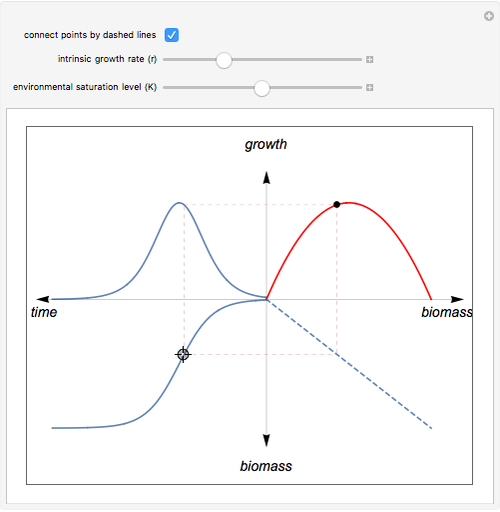
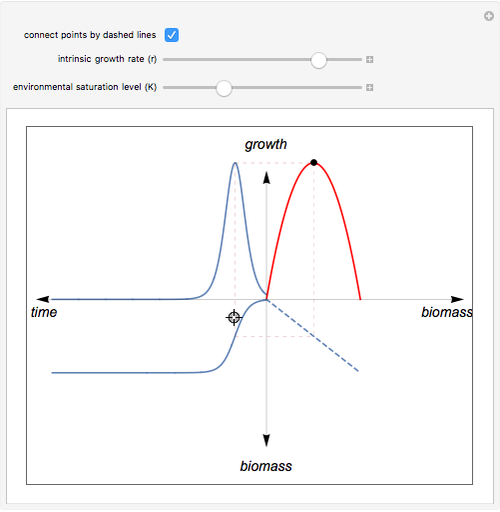
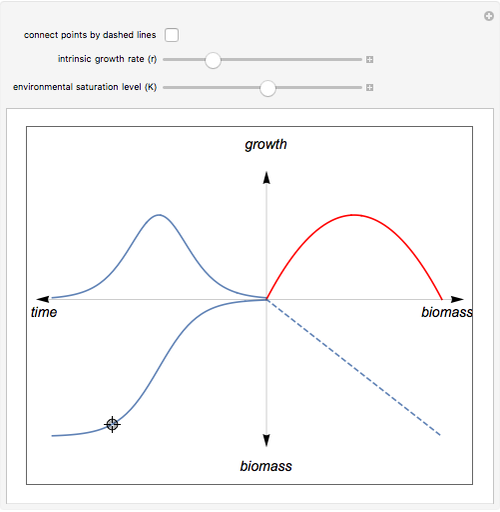
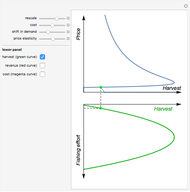
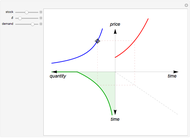
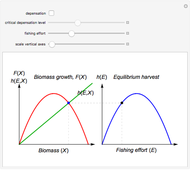
The Verhulst growth function (red curve) is the sum of the logistic growth function (lower blue curve) and its time derivative.
Contributed by: Arne Eide (March 2011)
Open content licensed under CC BY-NC-SA
Snapshots
Details
detailSectionParagraphPermanent Citation
"Surplus Production in Logistic Growth"
http://demonstrations.wolfram.com/SurplusProductionInLogisticGrowth/
Wolfram Demonstrations Project
Published: March 7 2011
Related Demonstrations
More by Author
 Model of Shell Growth
Stephen Wolfram Horn Growth in 2D
Stephen Wolfram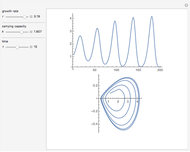 Hutchinson's Equation
Benson R. Sundheim Chaos in Tumor Growth Model with Time-Delayed Immune Response
Clay Gruesbeck Quasi-Rent in Open Access Fisheries
Arne Eide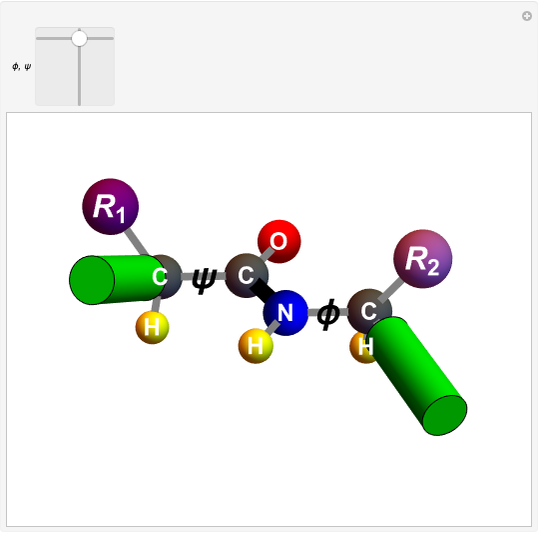 Elementary Processes in Protein Folding
S. M. Blinder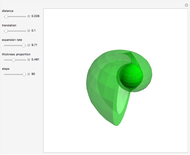 Shell Parameter Space
Jayna Resman, Michelle Winerip, Elizabeth Cowdery, and Allison Reed-Harris Shell Space: The 'Snugness' Condition
Phil Ramsden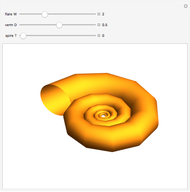 Shell Space: Flare, Verm, and Spire
Phil Ramsden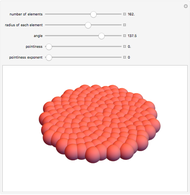 Phyllotaxis Spirals in 3D
Stephen Wolfram
-
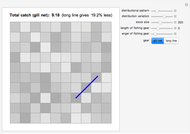 Fishing with Long Line or Gill Net?
Arne Eide -
 Faustmann's Rule of Optimal Rotation
Arne Eide -
 Intramarginal Rent
Arne Eide -
 The Economics of Emissions of a Flow Pollutant
Arne Eide -
 Curry Triangle Paradox
Arne Eide -
 The Backward-Bending Supply Function in Fisheries
Arne Eide -
 Optimal Queue of Cars
Arne Eide -
 Offspring of Adam and Eve
Arne Eide -
 Bioeconomics of a Discrete Ricker Model with Delayed Recruitment
Arne Eide -
 Maximizing the Present Value of Resource Rent in a Gordon-Schaefer Model
Arne Eide -
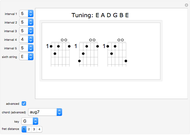 Guitar Chord Maker
Arne Eide -
 Ecosystem Dynamics
Arne Eide -
 Word Memory Game
Arne Eide -
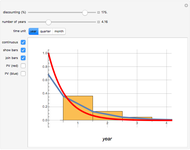 Continuous and Discrete Time Discounting
Arne Eide -
 A Nonlinear Stage-Structured Cannibalism Model
Arne Eide -
 Origami Bases
Arne Eide -
 Beverton and Holt's Yield per Recruit Model
Arne Eide -
 Non-Renewable Resource Economics
Arne Eide -
 Surplus Production Models and Equilibrium Harvest
Arne Eide -
 Cellular Automata Model of an MPA Fishery
Arne Eide