Contour Plot on a Hemisphere

Requires a Wolfram Notebook System
Interact on desktop, mobile and cloud with the free Wolfram Player or other Wolfram Language products.
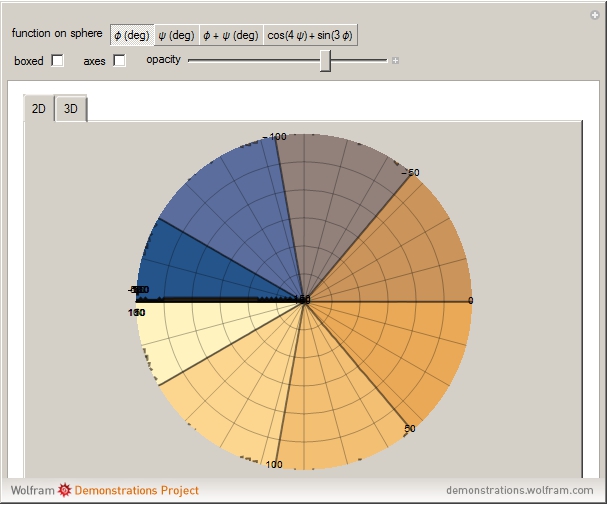
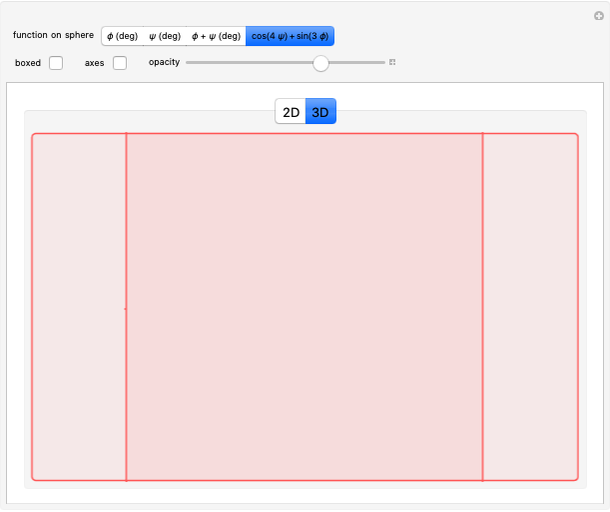
This Demonstration illustrates how Mathematica's built-in function ContourPlot can be used to produce a contour plot on the surface of a hemisphere.
Contributed by: Tom Verhoeff (August 2016)
(Eindhoven University of Technology, 2016)
Open content licensed under CC BY-NC-SA
Snapshots

Details
To make a spherical contour plot, map each point in the unit disk to a point on the northern hemisphere, and use ContourPlot on the unit disk with Cartesian coordinates. In this mapping, the distance  from the origin varies linearly with the latitude
  . This avoids compression near the edge, which would happen if
  were used. The resulting 2D contour plot in the unit disk is then transformed into a 3D contour plot on a hemisphere. You can choose four different functions to plot.
Permanent Citation
"Contour Plot on a Hemisphere"
http://demonstrations.wolfram.com/ContourPlotOnAHemisphere/
Wolfram Demonstrations Project
Published: August 8 2016
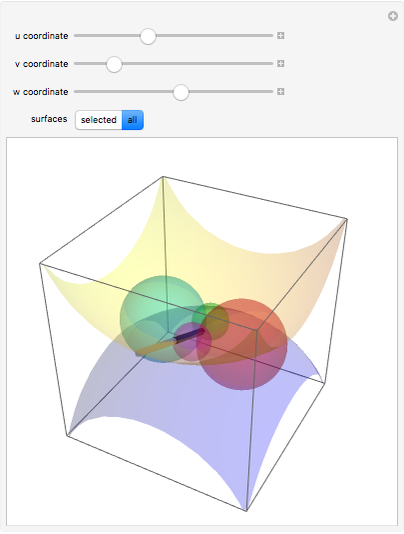 Six-Sphere Coordinates
Michael Schreiber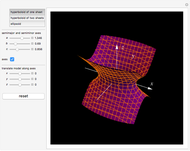 Hyperboloids and Ellipsoids
Lachlan Palmer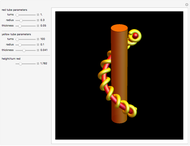 Double Spiral
John Compter Merging Mountains
Noel Patson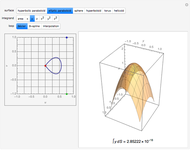 Surface Integrals over Segments of Parametrized Surfaces
Michael Rogers Unwrapping Involutes
Michael Rogers (Oxford College of Emory University) Normal Curvature at a Regular Point of a Surface
Desana ?tambuk (University of Zagreb) Cone Geodesics
Antonin Slavik Hyperboloid Geodesics
Antonin Slavik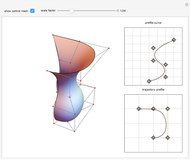 Constructing a Swung Surface around a B-Spline Curve
Shutao Tang
-
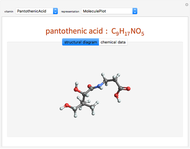 Vitamin Explorer
Tom Verhoeff -
 Contour Plot on a Hemisphere
Tom Verhoeff -
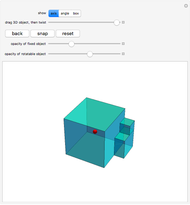
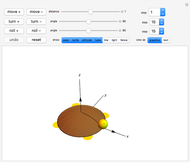 3D Flying Pipe-Laying Turtle
Tom Verhoeff -
 Euler's Rotation Theorem
Tom Verhoeff -
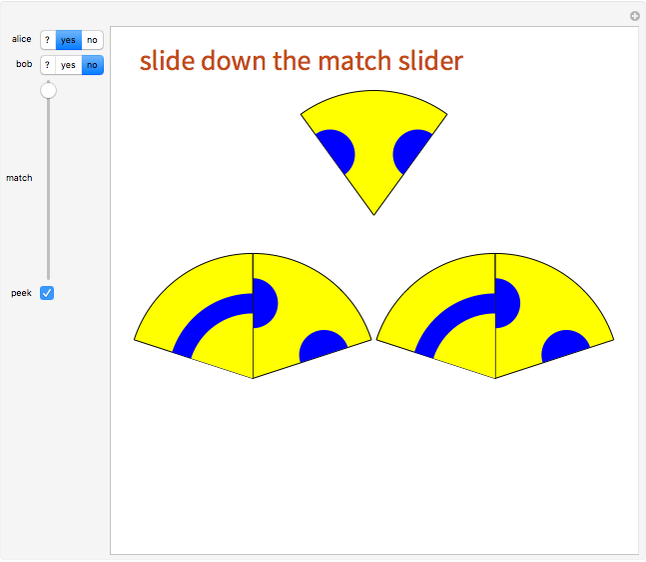 Zero-Knowledge Matchmaker
Tom Verhoeff -
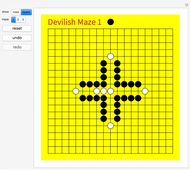 Devilish Mazes
Tom Verhoeff -
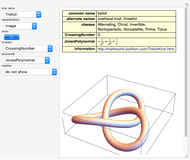 Knot Explorer
Tom Verhoeff -
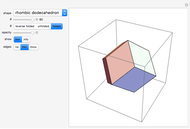 Shapes from Rhombuses
Tom Verhoeff -
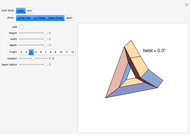
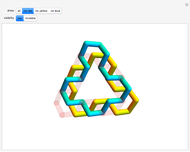 Paradoxical Triangular Braid
Tom Verhoeff -
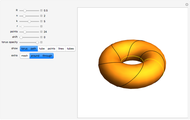 Torus Paths
Tom Verhoeff -
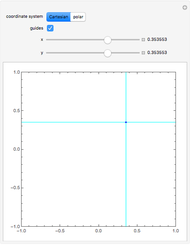 Switching between Overloaded Sliders
Tom Verhoeff -
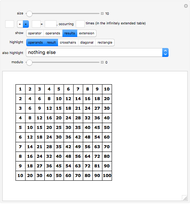 Exploring the Times Table
Tom Verhoeff -
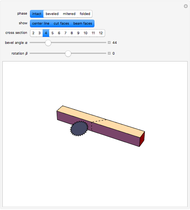 Miter Joint and Fold Joint
Tom Verhoeff -
 Mitering a Closed 3D Path
Tom Verhoeff