Fitness Model for Gene Frequency in Populations


Requires a Wolfram Notebook System
Interact on desktop, mobile and cloud with the free Wolfram Player or other Wolfram Language products.
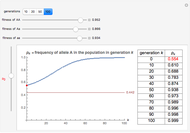
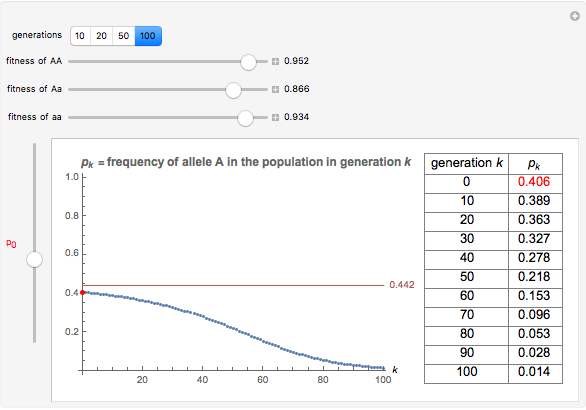
Imagine a single gene with two alleles, A and a, where the frequency of the A allele in the gene pool of an entire population is  . Assuming that this is a large and isolated population, that there is random mating, and that there are fixed fitness coefficients for each of the three possible genotypes AA, Aa, and aa through the generations, one can predict the frequency
  of the A allele in the population after
  generations.
Contributed by: Bruce Torrence (March 2011)
Open content licensed under CC BY-NC-SA
Snapshots
Details
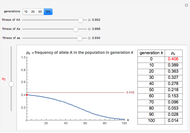
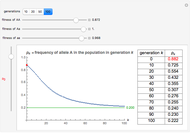
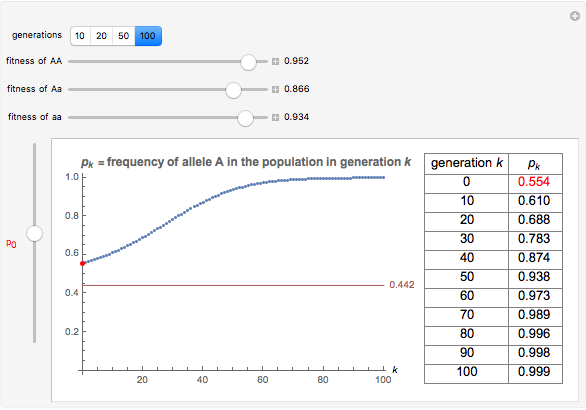
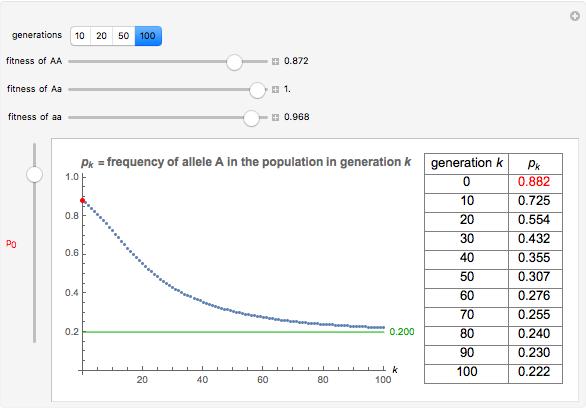
You will find that in some cases the A allele will truly become dominant and the other allele will go extinct (e.g., see Snapshot 1). Even with the same fitness coefficients, if the initial allele frequency of A is sufficiently small, it will go extinct (Snapshot 2). And in the case of heterozygous advantage (when the Aa fitness coefficient is 100% and the others are less), a stable limiting value for the frequency of A will manifest itself (Snapshot 3). This limiting value is indicated by a green line. The most famous example of heterozygous advantage is that of sickle cell anemia in certain tropical populations.
In some other cases a red horizontal line appears. This is a repelling (rather than attracting) stable value for the allele frequencies. That is, if is less than this value,  , while if is greater than this value,
  . Whether red or green, the limiting value is given by
  , where
  ,
,  , and
, and  are the fitness coefficients for aa, Aa, and AA, respectively.
The mathematics behind this Demonstration is quite simple and is widely documented. See, for example, chapter 6.4 of E. S. Allman and J. A. Rhodes, Mathematical Models in Biology: An Introduction, New York: Cambridge University Press, 2004.
Permanent Citation
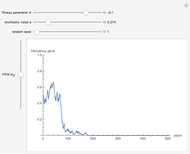 Stochastic Diploid Model for Gene Frequency in a Population
Sujatha Ramakrishnan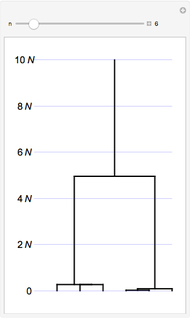 Coalescent Gene Genealogies
John Hawks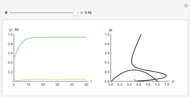 Bifurcation in a Model of Spruce Budworm Populations
Selwyn Hollis Genetic Drift of Allele Frequency
John Hawks Chaos in a Plant Pathogen/Hyperparasite Population Model
Michael Shaw Cooperation in Heterogeneous Populations
Bernhard Voelkl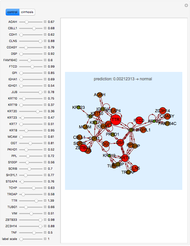 Sensitivity Analysis of Transition Phases of Perturbed Gene Pathways with a Neural Network
Luca Zammataro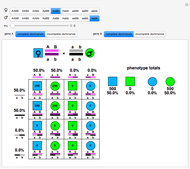 Breeding Outcomes with Two Autosomal Linked Genes
Amy Blinder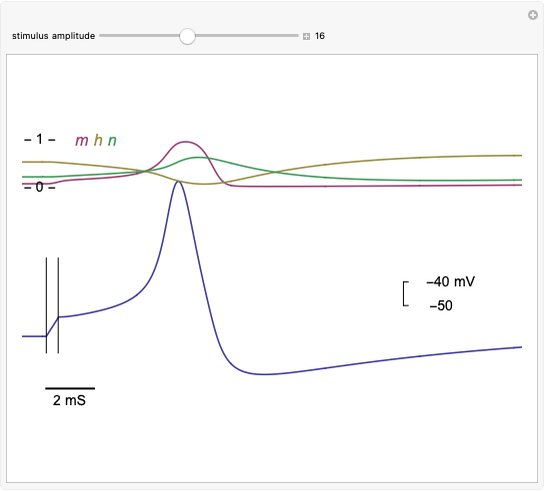 Hodgkin-Huxley Action Potential Model
Shimon Marom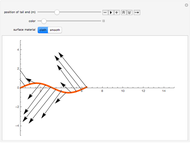 Model of Snake Locomotion by Frictional Forces
Christopher Umeki and Gregor Wettermann
-
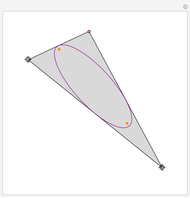 Marden's Theorem
Bruce Torrence -
 Sendov's Conjecture
Bruce Torrence -
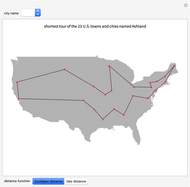 U.S. City Tours
Bruce Torrence -
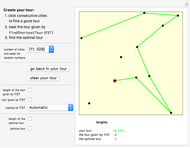 Solving Hard Traveling Salesman Problems
Bruce Torrence -
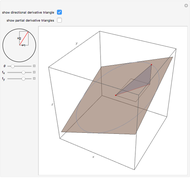 Directional Derivatives and the Gradient
Bruce Torrence -
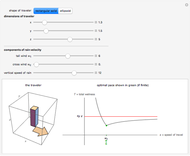 Running in the Rain
Bruce Torrence -
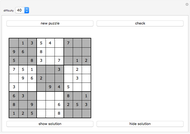 Sudoku Game
Bruce Torrence -
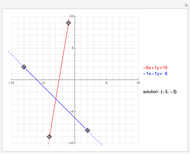 Two-by-Two Linear Systems Problem Generator
Bruce Torrence -
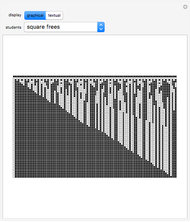 The Locker Problem
Bruce Torrence -
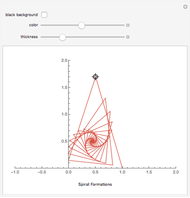 Spiral Formations from Iterated Exponentiation
Bruce Torrence -
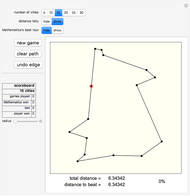 Traveling Salesman Game
Bruce Torrence -
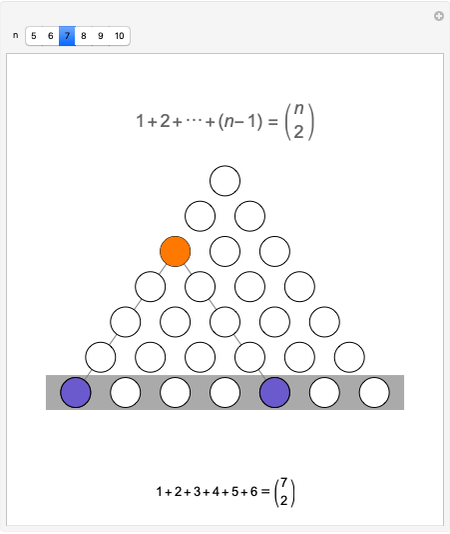 Proof without Words: 1+2+...+(n-1)=n Choose 2
Bruce Torrence -
 Fitness Model for Gene Frequency in Populations
Bruce Torrence -
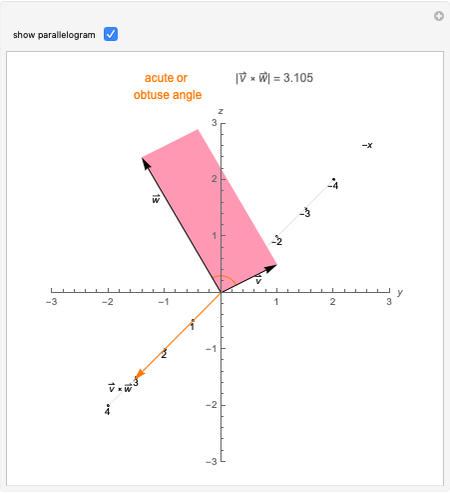 Cross Product of Vectors in the y-z Plane
Bruce Torrence -
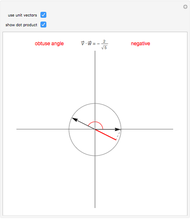 Dot Product
Bruce Torrence -
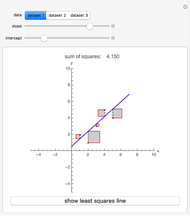 Least Squares Criteria for the Least Squares Regression Line
Bruce Torrence -
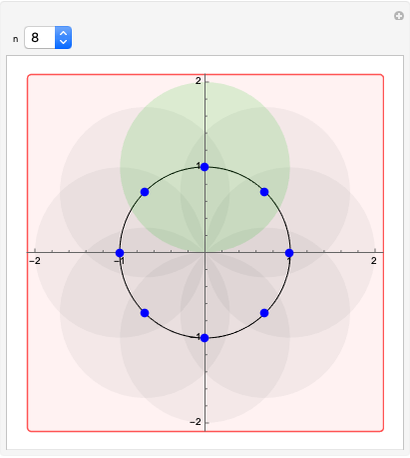
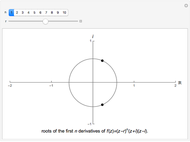 Roots of the Derivatives of a Certain Real Polynomial in the Complex Plane
Bruce Torrence -
 Lucas-Gauss Theorem
Bruce Torrence -
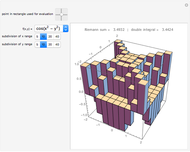 Riemann Sums for Functions of Two Variables
Bruce Torrence