Generalized Extreme Value Distributions: Application in Financial Risk Management

Requires a Wolfram Notebook System
Interact on desktop, mobile and cloud with the free Wolfram Player or other Wolfram Language products.
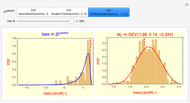
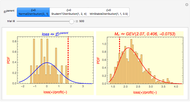
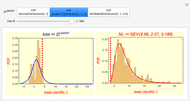
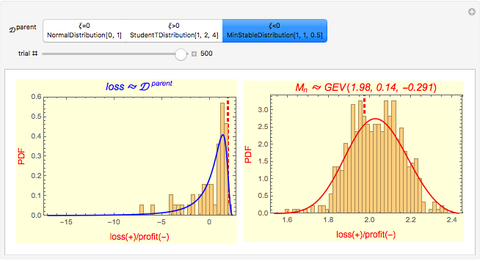
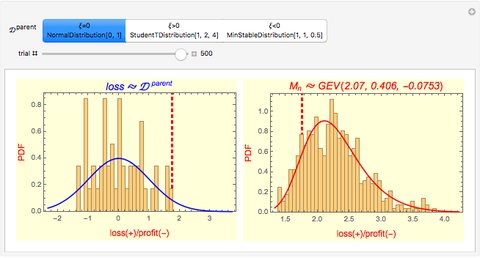
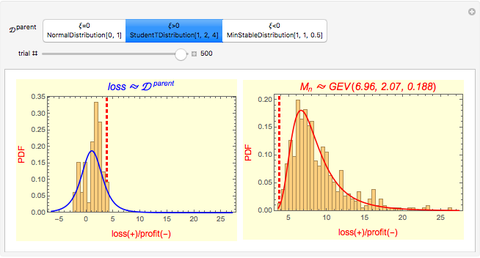
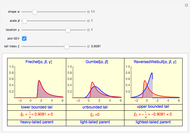
This Demonstration illustrates the Fisher–Tippett–Gnedenko theorem in the context of financial risk management. A sample of  observations is drawn from a parent distribution
  that describes the probability of historical losses of a portfolio (left-hand plot). A number of draws (
 ) are repeated to obtain a histogram of 500 maximal losses (
 ), shown as a running cumulative in the right-hand plot. At each draw, the position of is marked by a red vertical dashed line.


Contributed by: Pichet Thiansathaporn (February 2013)
Open content licensed under CC BY-NC-SA
Snapshots
Details
Reference
[1] K. Dowd, Measuring Market Risk, 2nd ed., West Sussex, England: Wiley, 2005 pp. 190–194.
Permanent Citation
 Principal Components Analysis: Application in Value at Risk and Expected Shortfall
Pichet Thiansathaporn Earned Value Management
Hagen Lotze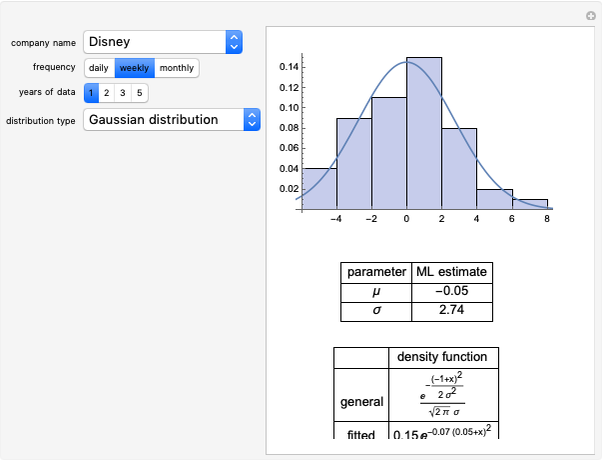 Modeling Return Distributions
Jeff Hamrick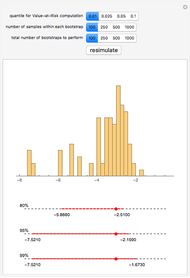 Bootstrapping to Compute Value-at-Risk Standard Errors
Jeff Hamrick Attributing Portfolio Value at Risk: Relations with Component VaR, Marginal VaR, and Incremental VaR
Pichet Thiansathaporn Financial Engineering of a Bond
Thomas Lindner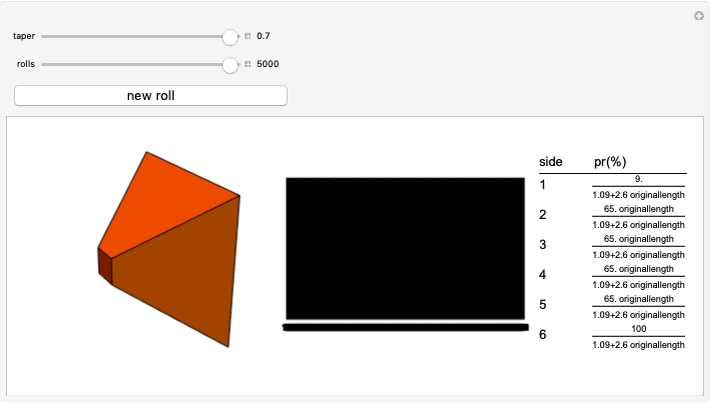 Risk, Ownership, and Control
Roger J. Brown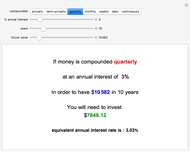 Present Value Calculator
Craig Bauling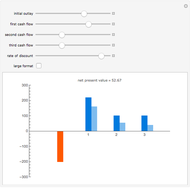 Net Present Value
Fiona Maclachlan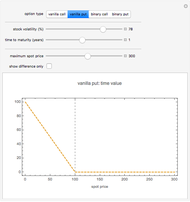 Options: Time Value
Peter Falloon
-
 Generalized Extreme Value Distributions: Application in Financial Risk Management
Pichet Thiansathaporn -
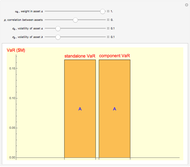 Portfolio Diversification Benefit from Subadditive VaR
Pichet Thiansathaporn -
Attributing Portfolio Value at Risk: Relations with Component VaR, Marginal VaR, and Incremental VaR
Pichet Thiansathaporn -
Principal Components Analysis: Application in Value at Risk and Expected Shortfall
Pichet Thiansathaporn -
 Fisher-Tippett-Gnedenko Theorem: Generalizing Three Types of Extreme Value Distributions
Pichet Thiansathaporn