Linking Autocorrelation of Gaussian Random Process to Conditional Probabilities
Initializing live version

Requires a Wolfram Notebook System
Interact on desktop, mobile and cloud with the free Wolfram Player or other Wolfram Language products.
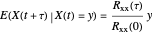
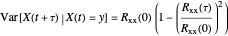
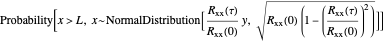
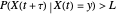
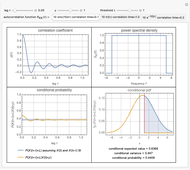
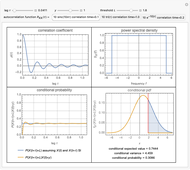
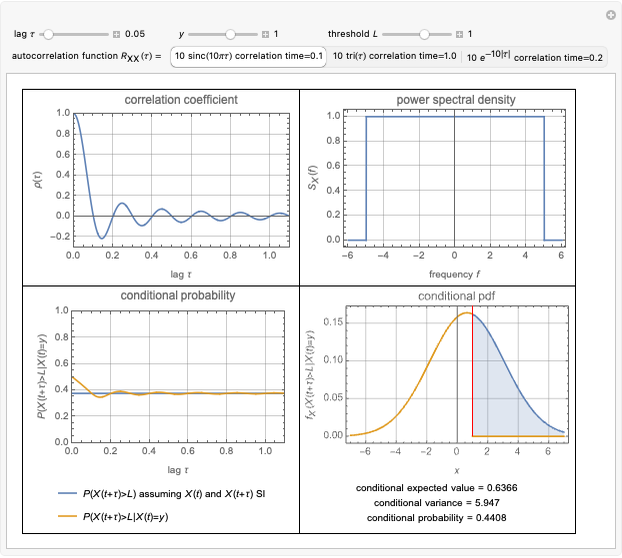
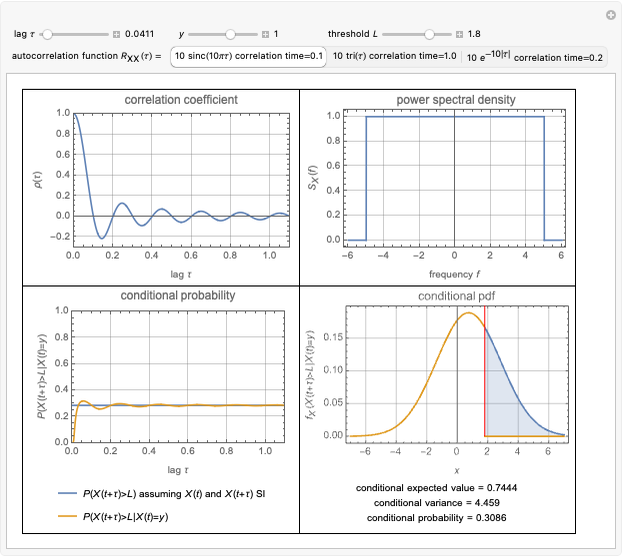
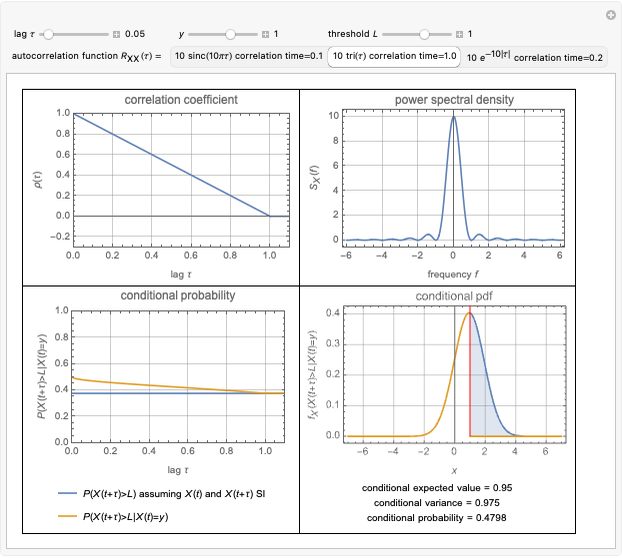
For a zero-mean Gaussian random process  , the probability density function (pdf) of the conditional random variable
  is Gaussian. Its properties can be calculated from the autocorrelation (or power spectral density) of the process,
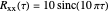
  (or
(or  ).
).


Contributed by: Victor S. Frost (October 12)
(University of Kansas)
Open content licensed under CC BY-NC-SA
Details
Reference
[1] K. S. Shanmugan and A. M. Breiphol, Random Signals: Detection, Estimation and Data Analysis, New York: Wiley, 1988.
Snapshots
Permanent Citation
Related Demonstrations
More by Author
 Transformation to Symmetry of Gamma Random Variables
Ian McLeod and Nagham Muslim Mohammad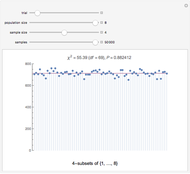 Goodness of Fit for Random Subsets
Michael Rogers (Oxford College of Emory University) Informal Power Assessment of the Normal Probability Plot
Ian McLeod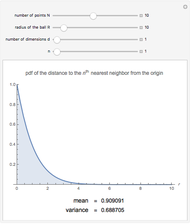 Distance Distributions in Finite Uniformly Random Point Processes
Sunil Srinivasa and Martin Haenggi Fractional Gaussian Noise
Ian McLeod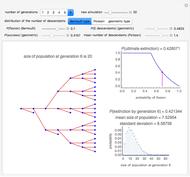 Simulating the Branching Process
Heikki Ruskeepää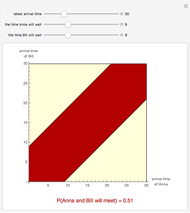 A Random Meeting
Heikki Ruskeepää Random Harmonic Series
Heikki Ruskeepää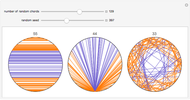 Random Chord Paradox
Ed Pegg Jr A Reluctant Random Walk
Heikki Ruskeepää
-
 Linking Autocorrelation of Gaussian Random Process to Conditional Probabilities
Victor S. Frost -
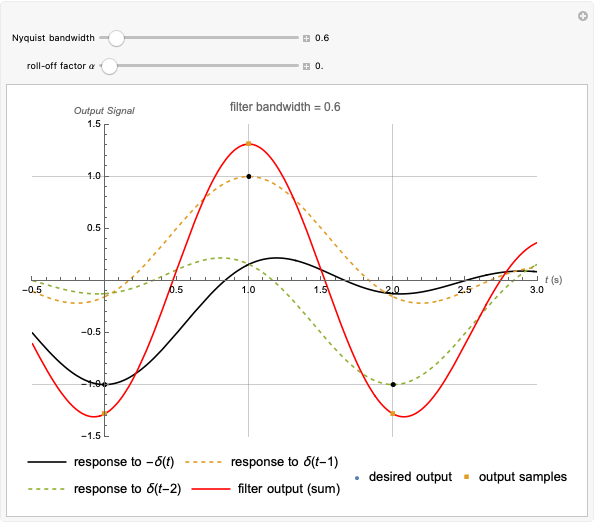 Intersymbol Interference with Raised Cosine Pulses
Victor S. Frost -
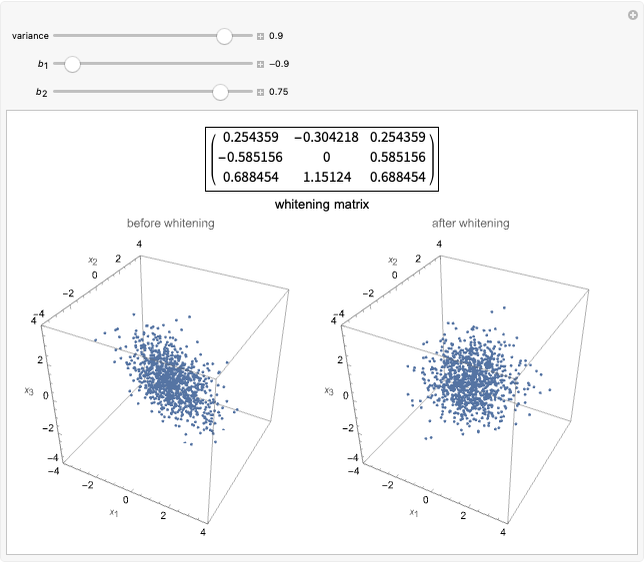 Whitening of a Multivariate Gaussian Random Vector
Victor S. Frost -
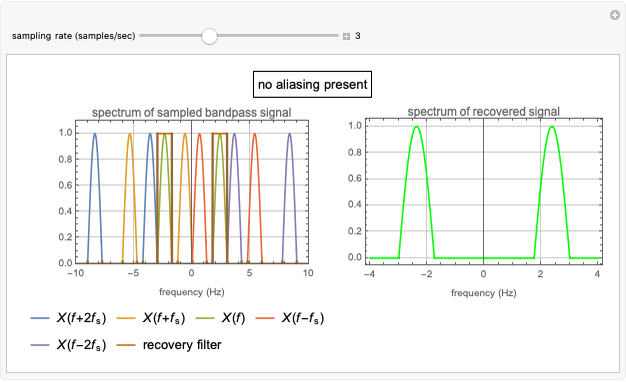 Sampling a Bandpass Signal
Victor S. Frost -
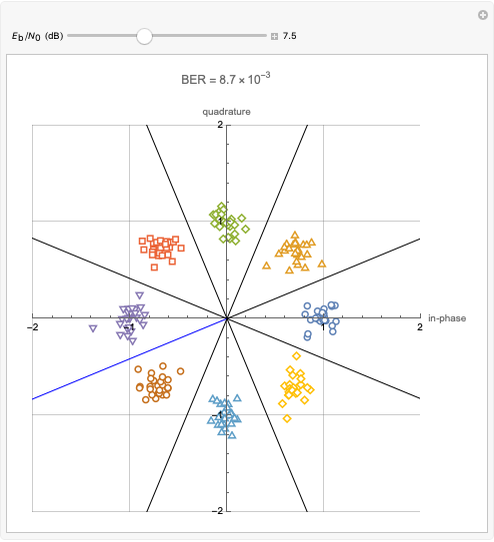
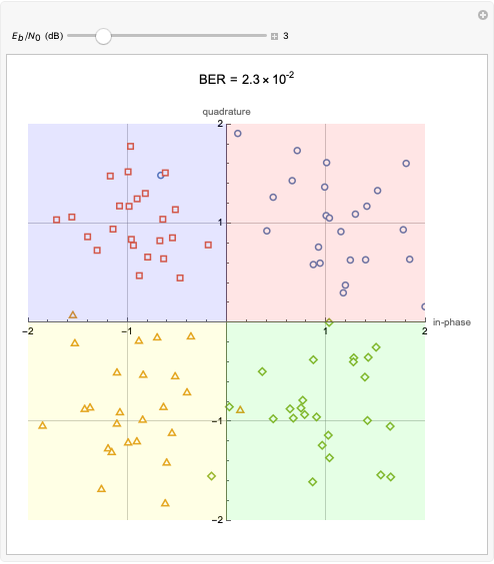 Signal Constellation of Quadrature Phase Shift Keying Modulation in Noise
Victor S. Frost -
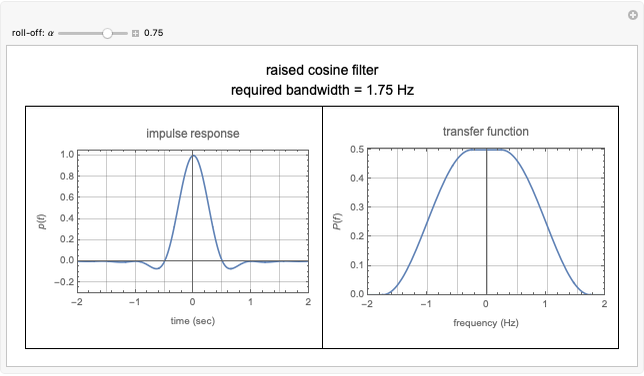 Impulse Response and Transfer Function of a Raised Cosine Filter
Victor S. Frost -
 Constructing an Eye Diagram
Victor S. Frost -
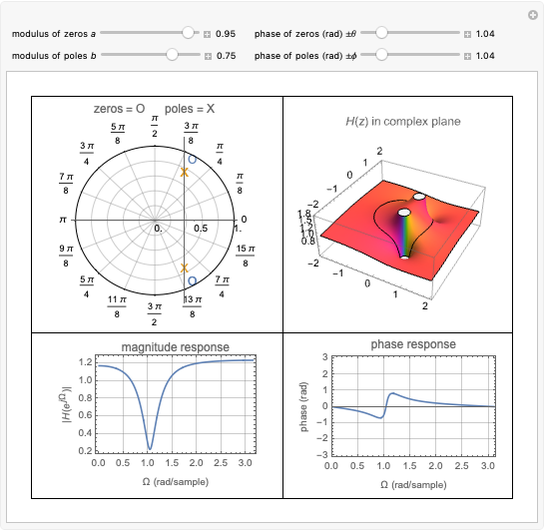 Second-Order Digital Filter Design
Victor S. Frost -
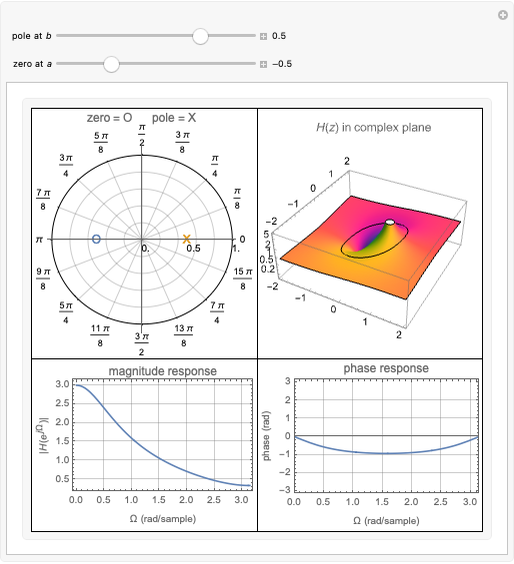 First-Order Digital Filter Design
Victor S. Frost -
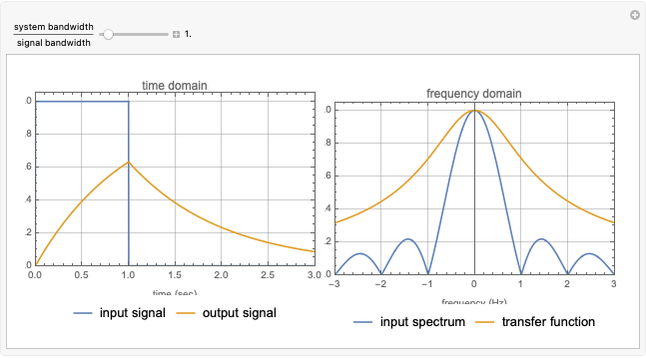 Linear Distortion and Signal Bandwidth
Victor S. Frost -
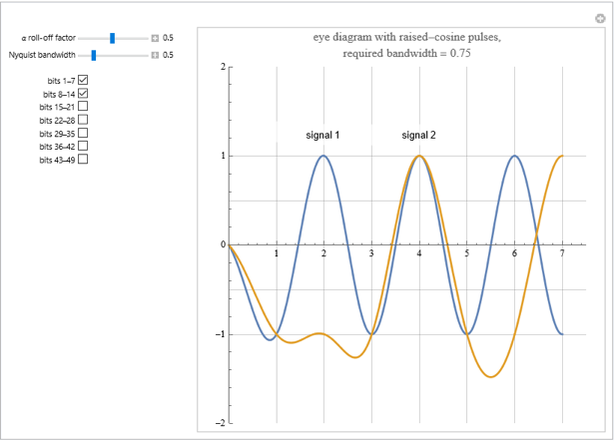
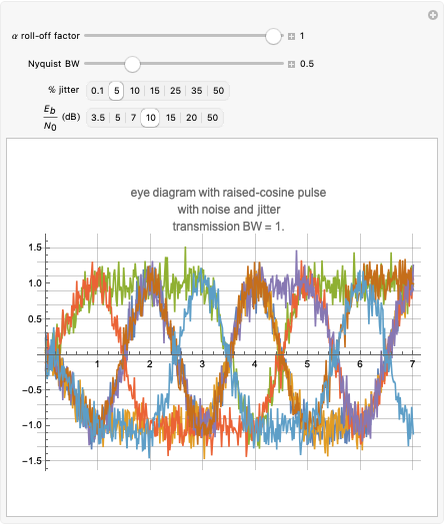 Eye Diagrams for Raised-Cosine Pulses
Victor S. Frost -
 Signal Constellation of Eight-Phase Shift-Keying Modulation in Noise
Victor S. Frost -
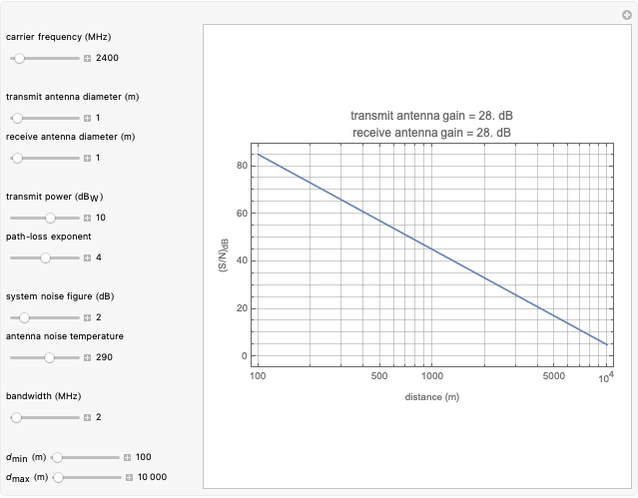 Link Budget for Communication Systems
Victor S. Frost -
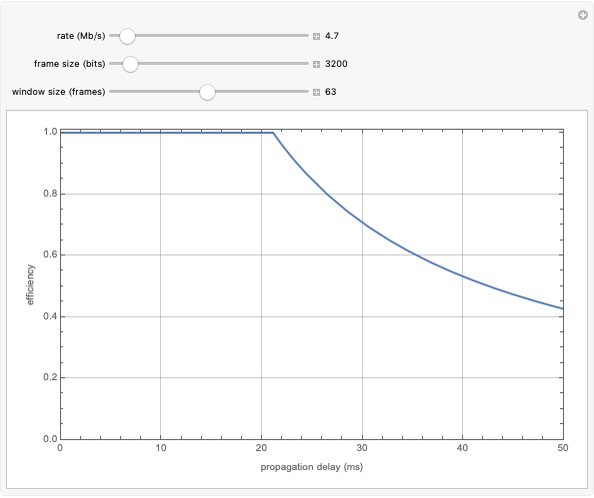 Efficiency versus Delay for a Sliding-Window Data-Link Control Protocol
Victor S. Frost -
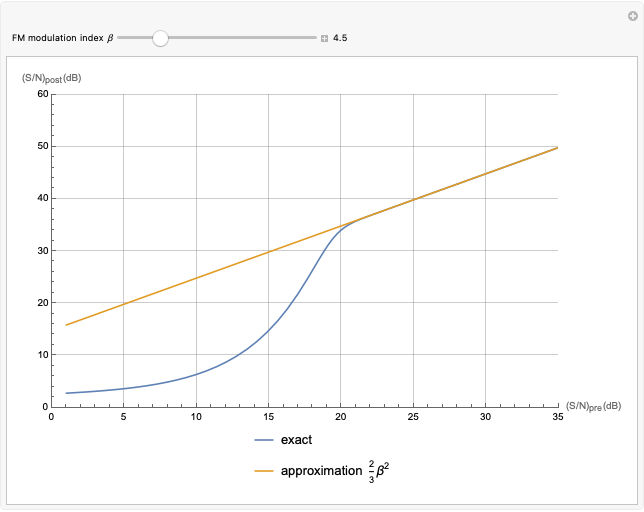 Noise Performance of an FM Demodulator
Victor S. Frost