Markov Volatility Random Walks

Requires a Wolfram Notebook System
Interact on desktop, mobile and cloud with the free Wolfram Player or other Wolfram Language products.
A decent first approximation of real market price activity is a lognormal random walk. But with a fixed volatility parameter, such models miss several stylized facts about real financial markets. Allowing the volatility to change through time according to a simple Markov chain provides a much closer approximation to real markets. Here the Markov chain has just two possible states: normal or elevated volatility. Either state tends to persist, with a small chance of transitioning to the opposite state at each time-step.
Contributed by: Jason Cawley (March 2011)
Open content licensed under CC BY-NC-SA
Snapshots
Details
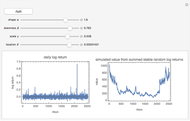
Volatility is controlled here by a Markov-chain process. It remains at the base volatility value unless a spike event occurs. If one does, volatility remains elevated until a chance return to normal.
A Markov chain is fully specified by a state transition matrix giving the probability to pass from each possible state to every other state. The chain is Markov in the sense of being conditionally independent on its past—its only "memory" is its present state. Probabilities in a Markov chain may be 0 (impossible transitions) or 1 (certain transitions).
Here the normal volatility state persists with a probability near 1, passing to the "spike" volatility state according to the "spike chance" parameter. The spike volatility state returns to normal with probability 1 divided by the "spike length" parameter; therefore spikes will occur with a random distribution of lengths, with the control parameter determining the average length of a spike. During the spike, volatility is equal to the baseline volatility times the "spike strength" parameter.
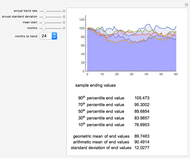
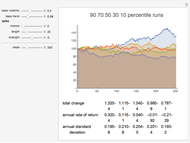
Once the volatility is specified, the remainder of the behavior is a standard lognormal random walk, with a drift term given by the "base trend" parameter. Multiple paths are calculated and ranked according to ending value. Representative paths are shown at various deciles of ending value, along with descriptive statistics of that path.
Set "spike chance" to 0 to see lognormal returns without stochastic volatility. Notice that even over many runs, the kurtosis remains close to the Gaussian distribution value of 3.00. This is seen on real markets only in exceptionally calm periods.
Kurtosis measures how much of the weight of a distribution is concentrated in the tails and the peak, as opposed to the midrange flanks. Higher kurtosis means fatter tails and a sharper peak. Lower kurtosis means broader shoulders.
With a 1% spike chance, 20-day expected spike length, and three times spike strength, kurtosis values around 10 are common, and kurtosis varies widely from one series to the next. This is much closer to the pattern seen in actual stock returns, which typically show values between 3 and 10, with high variability from stock to stock and period to period.
Notice the annualized standard deviation is well above the baseline level with spikes included, and more variable from run to run. The lower the spike chance and the shorter the spike period, the less time spent at the higher volatility, and the closer the typical total volatility will be to the baseline level.
Over short enough time scales—try 20 or 50 days for example—the chance of entering a volatility spike may be so low the standard deviations remain tightly clustered around the baseline level, and most runs will show a Gaussian value for the kurtosis. Occasionally one of the sample paths will show elevated kurtosis. Longer periods will nearly always show elevated kurtosis if the spike chance is appreciable.
Most stylized facts of real markets can be captured by this simple model: fat tails, elevated kurtosis, volatility clustering, variable standard deviations, sensitivity of descriptive statistics to time period selections, and so on. In real markets, volatility spikes may vary more in amplitude, but this is masked by randomness in the daily moves themselves and in varying periods spent at elevated volatility.
Volatility spikes can be caused by company-specific developments or wider systematic events. Wider systemic events would appear as correlated volatility spikes across multiple stocks or asset classes.
Permanent Citation
"Markov Volatility Random Walks"
http://demonstrations.wolfram.com/MarkovVolatilityRandomWalks/
Wolfram Demonstrations Project
Published: March 7 2011


