Credit Risk


Requires a Wolfram Notebook System
Interact on desktop, mobile and cloud with the free Wolfram Player or other Wolfram Language products.
In corporate debt markets, credit risk refers to the risk of loss from bond defaults, as distinct from bond price changes due to fluctuating interest rates, called interest rate risk. Rating agencies provide historical information on the past probability of defaults, as well as year to year changes in bond ratings. Their historical data is used here to construct a Markov chain model of credit risk, showing the changes in ratings through time and loss figures for a random sample of 100 simulated bonds of a given initial credit rating.
Contributed by: Jason Cawley (March 2011)
Open content licensed under CC BY-NC-SA
Snapshots


Details
The underlying data are taken from a study by Moody's, based on 30 years of past corporate bond performance. Naturally the past is an imperfect indicator of future risks and losses, and the Demonstration should therefore be used with caution.
Each year, any given bond in the simulated sample may transition from its previous credit rating to another, or may default. Once past the bond's call protection period, it may instead be called (prepaid in full). The probabilities of each transition are taken from past data for that bond rating class. The simulation is Markovian—only the present credit rating of the bond at each point in time influences its future behavior.
The bond rating categories provided are Aaa, Aa, A, Baa, Ba, B, and C. Default and called are additional possible "absorbing" categories. Ratings of Baa and above are considered "investment grade", while ratings below that are considered "high yield" or "junk" bonds.
Initial maturity can also have a strong effect on eventual behavior, as bonds outstanding for a much longer period of time simply have more chances to migrate through the ratings. If call-protected only for a short initial period, moreover, most very long dated bonds will leave the sample before final maturity date, through call or default. This is particularly true for lower quality bonds, as those have a high chance of either "absorbing" outcome occurring.
The sample size is fixed at 100 bonds of the same type, to keep the display manageable and comparisons meaningful. Note, however, that real portfolios of distinct bonds of that size may show higher correlations in their rating changes and default behavior than is illustrated here. The sample should instead be thought of as distinct possible paths for an individual bond. The individual paths are independent.
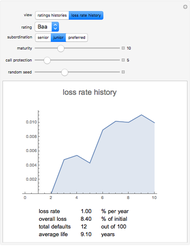
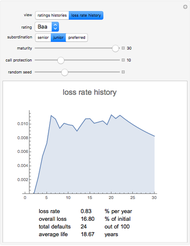
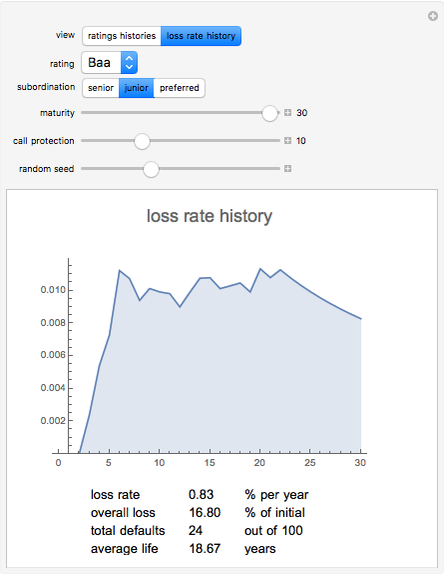
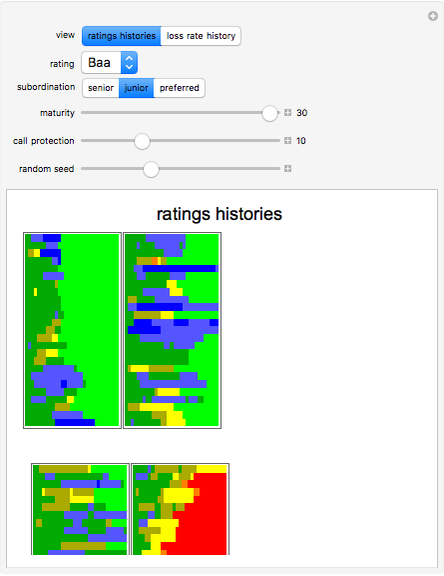
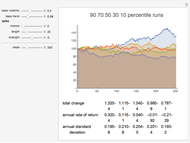
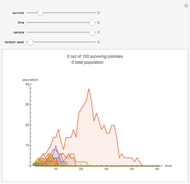
Two views are provided: a ratings history view and a loss history view. The first shows each simulated bond as a separate horizontal line, one cell per year of its life, with the rating in that year shown as the cell's color. These histories are sorted such that the worst performing bonds in the sample are listed last and the best performing are listed first. The second shows a graph of the average rate of loss experienced through a given date across the sample, as an annual rate, on the remaining capital outstanding. A few summary statistics on the sample are also provided: the loss rate as of the maturity date, the total loss as a portion of initial capital, the number of defaults in the sample, and the average life of the bonds.
The additional subordination control only influences the severity of loss in the event of default. Senior bonds are paid before other creditors, and therefore tend to retain some value even in bankruptcy proceedings. Junior or subordinated debt is in a less favorable position, and preferred stock is in a still lower tier, and is frequently wiped out in the event of default. Moody's average values of senior securities one month after a default are used to determine how much value remains for each bond type, if a default occurs. Note that in reality, junior positions are also typically associated with lower credit ratings, and should be input accordingly.
Losses are realized only when a bond defaults. In reality, investors in investment grade bonds may wind up selling at prices below par well before default, for example as soon as the bond rating falls below investment grade. The Demonstration source code provides the information needed to simulate such selling decision rules, but an actual application of such a rule is beyond its scope.
Call protection controls whether or not a bond can be repaid before maturity without an event of default. Within the call protection time window, no prepayments will occur. After it, the historical average rates of repayment for that rating category are used. In reality, whether a bond is called is sensitive to changes in interest rates since the time of issuance, but no attempt is made to model that here. If a bond is called or after it has defaulted, it no longer forms part of the denominator for the yearly loss rate calculation.
As the first snapshot shows, in the early years of middling credit's life, the loss rate to date rises with length of time outstanding so far. It takes time for a bond to diffuse downward through the lower credit ratings before the risk of default reaches appreciable levels. The next snapshot shows the average loss rate for a much longer maturity bond eventually levels off. It takes larger absolute losses to date to maintain the same percentage per year loss rate to longer times, and the bonds remaining have a decreasing weight in the overall average. The third shows the ratings histories for the same sample—notice that most bonds have either defaulted or been called by about the 20 year mark.
The next snapshot shows an intermediate term, high yield sample of junior "B" rated bonds. Notice the much higher portion of defaults even in the much shorter period. Nearly half of this sample defaulted, with an overall loss of 30% of the initial capital. The average life of these nominally 10 year bonds was only about 7 years, as defaults or early calls winnowed the sample. It would take a premium of nearly 5% per year just to cover the realized credit losses, without even offering a spread over higher-quality bonds in exchange for greater risk. Highly rated bonds might show no defaults at all over that limited a period of time, or perhaps 1 or 2 out of 100. Senior bonds would also lose less on each default.
Drag the "random seed" control to get a sense of the variability of performance across samples of this size. The lower rated credits may show sample to sample variations in the average loss rate of a factor of 2 or more.
Permanent Citation
"Credit Risk"
http://demonstrations.wolfram.com/CreditRisk/
Wolfram Demonstrations Project
Published: March 7 2011
 Markov Volatility Random Walks
Jason Cawley Bootstrapping Credit Default Swap Data
Jeff Hamrick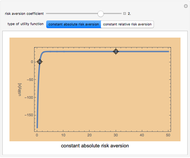 Constant Risk Aversion Utility Functions
Seth J. Chandler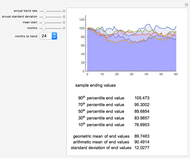 Mean-Reverting Random Walks
Jason Cawley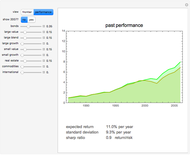 Asset Allocation
Jason Cawley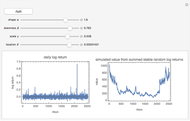 Stock Price Simulation Using Stable Random Variables
Bob Rimmer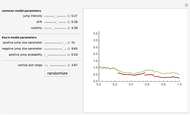 Two Jump Diffusion Processes
Andrzej Kozlowski The Return Distribution of the Variance Gamma Process
Andrzej Kozlowski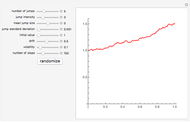 Merton's Jump Diffusion Model
Andrzej Kozlowski Brownian Bridge
Andrzej Kozlowski
-
 Expected Returns of the Dow Industrials, Beta Model
Jason Cawley -
 Comparing Data on Countries
Jason Cawley -
 Rank Plots for Countries
Jason Cawley -
 Country Groups
Jason Cawley -
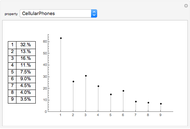 Country Data and Benford's Law
Jason Cawley -
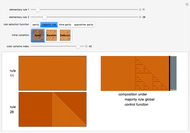 Cellular Automata with Global Control
Jason Cawley -
 Simulating the 2008 U.S. Presidential Election
Jason Cawley -
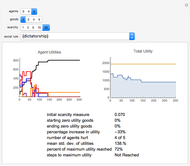 Exploring Social Choice Theory
Jason Cawley -
 Fully Random, Five-Rule Interactive Cellular Automata (ICA)
Jason Cawley -
 Algorithmic Architecture with Cellular Automata
Jason Cawley -
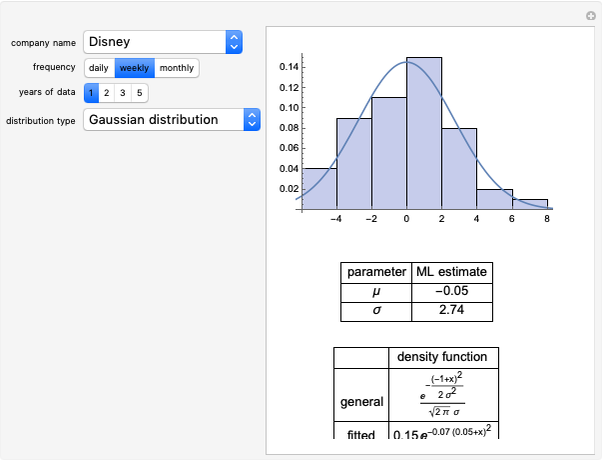 Modeling Return Distributions
Jason Cawley -
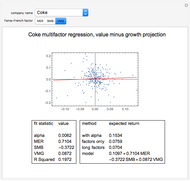 Expected Returns of the Dow Industrials, Fama-French Model
Jason Cawley -
 Credit Risk
Jason Cawley -
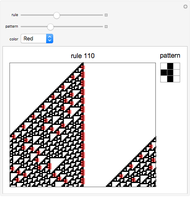 Highlighting Patterns in Cellular Automata
Jason Cawley -
Markov Volatility Random Walks
Jason Cawley -
Asset Allocation
Jason Cawley -
Mean-Reverting Random Walks
Jason Cawley -
 An Amoeba Problem
Jason Cawley -
 Totalistic K3 R 1/2 Cellular Automata
Jason Cawley -
 Cellular Automaton Model of Pine Savanna Dynamics in Response to Fire and Hurricanes
Jason Cawley