McCabe & Thiele Graphical Method


Requires a Wolfram Notebook System
Interact on desktop, mobile and cloud with the free Wolfram Player or other Wolfram Language products.
Distillation is one of the most ubiquitous methods for the separation of chemicals. The simplest distillation column has three streams: feed, distillate, and bottom (or residue). Feed is the mixture that is treated using the distillation column in order to separate its constituents. Feed can be a binary or a multicomponent mixture of chemicals. Distillate and bottom are subject to product purity specifications.
Contributed by: Housam Binous (September 2007)
Open content licensed under CC BY-NC-SA
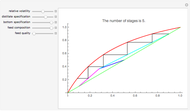
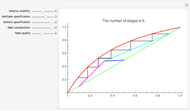
Snapshots


Details
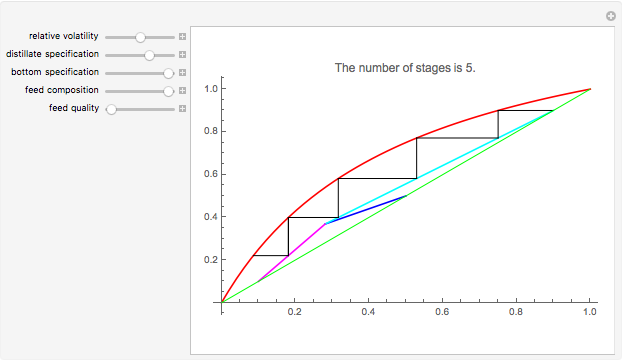
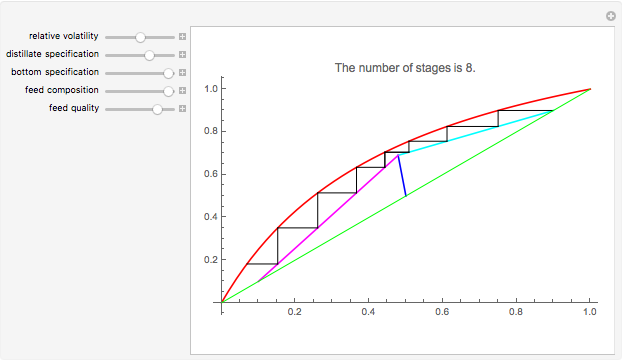
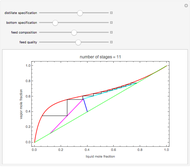
This Demonstration presents the McCabe and Thiele graphical method, which is applicable to binary mixtures. First, the rectifying and stripping operating lines are plotted using a reflux ratio equal to 1.5 times the minimum reflux ratio. These lines are derived by writing global and partial material balances around different sections of the column. The feed line is also plotted. If the construction is correct, these three lines must intersect at the same point. For the separation to be feasible, you must choose parameters (feed quality, bottom, feed and distillate compositions and relative volatility) that cause the intersection point to fall below the equilibrium curve. The equilibrium curve is plotted assuming constant relative volatility. A large constant relative volatility indicates that the separation is easy, while values of this parameter close to 1 will result in a large number of theoretical plates. The stages are stepped off using the equilibrium curve and the two operating lines in order to determine the number of equilibrium stages or the number of theoretical column plates.
The horizontal and vertical axes are the liquid and vapor mole fractions. The curve is the equilibrium curve. In fact, every liquid (with mole fraction  ) is in equilibrium with its vapor (with mole fraction
  ). If relative volatility is constant, there is a simple relation between and . The line segments allow a visualization of the steps, which are equilibrium stages.
One limitation of this approach is that it will not work when the feed is saturated "liquid" (feed quality  ) because the slope of the feed line becomes infinity. The Demonstration displays the number of stages, which is the sum of the plates in the rectifying and stripping sections. The optimum feed plate is the stage where the operating lines intersect.
Reference:
(1) H. Binous, "Equilibrium Staged Separations using Matlab® and Mathematica®," Chemical Engineering Education, 42(2), 2008 pp. 69-73.
Permanent Citation
 McCabe-Thiele Graphical Method for a Non-Ideal Binary Mixture
Housam Binous Applications of Driving-Force and McCabe-Thiele Diagrams to Binary Distillation Processes
Housam Binous Ponchon-Savarit Graphical Equilibrium Stage Method
Housam Binous Ponchon-Savarit Graphical Method at Total Reflux
Housam Binous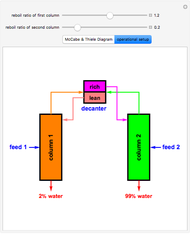 Separation of a Partially Miscible Mixture Shown by Graphical Method
Housam Binous and Ahmed Bellagi Graphical Method for Evaluating the Performance of N Tanks in Series
Housam Binous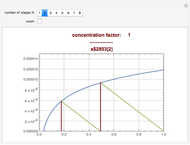 Graphical Solution for a Multistage Continuous Feed-and-Bleed Ultrafiltration System
Housam Binous and Ahmed Bellagi Kremser Shortcut Method for Absorption and Stripping
Housam Binous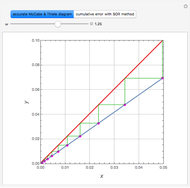 Gas Absorption Computed Using the Successive Over-Relaxation (SOR) Method
Housam Binous Solving Stefan-Maxwell Equations Using Orthogonal Collocation and Shooting Method
Housam Binous, Brian G. Higgins, and Ahmed Bellagi
-
 Liquid-Liquid Equilibrium for the 1-Butanol-Water System
Housam Binous -
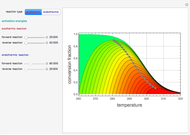
 Temperature Dependence of Dehydrogenation of Ethyl Benzene to Styrene
Housam Binous -
 Deconvolution of a Chromatogram
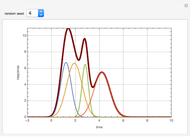
Housam Binous -
 Distribution of Colloidal Particles during Solvent Evaporation
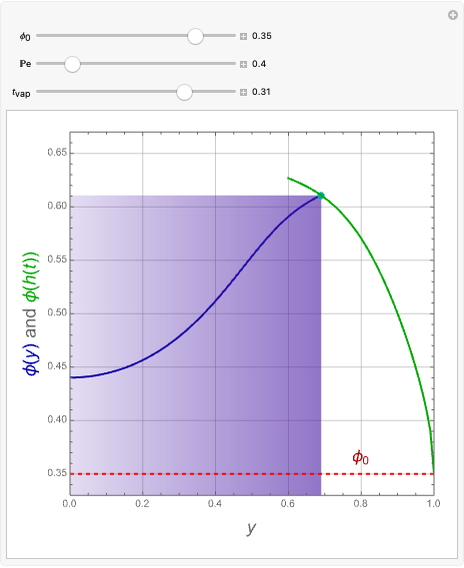
Housam Binous -
 Heat Conduction in a Rod
Housam Binous -
 Optimal Setup of Two Continuous Stirred-Tank Reactors (CSTRs) in Series
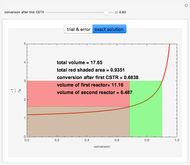
Housam Binous -
 Study of the Dynamic Behavior of the Lorenz System
Housam Binous -
 A Graphically Enhanced Method for Computing Real Roots of Nonlinear Functions
Housam Binous -
 Design of a Shell and Tube Heat Exchanger
Housam Binous -
 Correction Factor for Shell and Tube Heat Exchanger
Housam Binous -
 Contour Plots for Reaction Rates
Housam Binous -
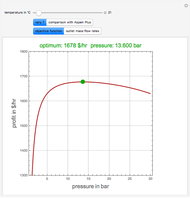 Optimal Conditions for CO2/n-Hexane Flash Separation
Housam Binous -
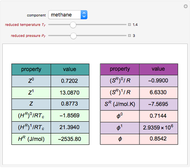
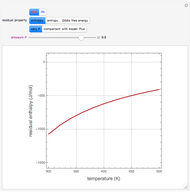 Residual Functions for the SRK and PR Equations of State
Housam Binous -
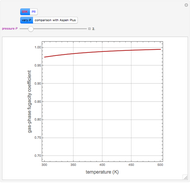 Gas-Phase Fugacity Coefficients for Propylene
Housam Binous -
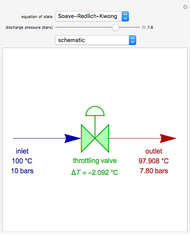 Operation of a Throttling Valve
Housam Binous -
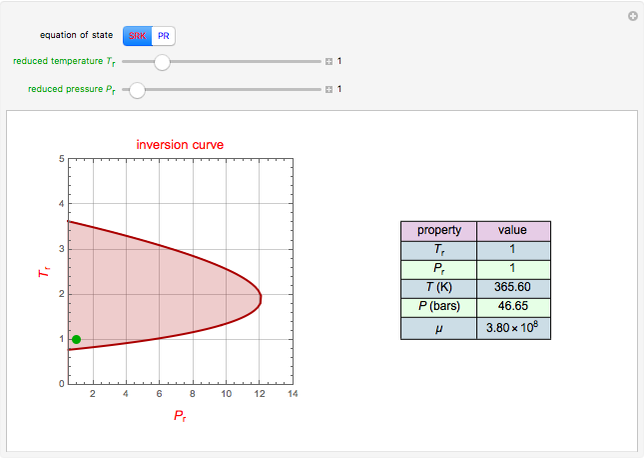 Joule-Thomson Inversion Curves for Soave-Redlich-Kwong (SRK) and Peng-Robinson (PR) Equations of State
Housam Binous -
 Lee-Kesler Generalized Correlations for Gases
Housam Binous -
 Mapping the Maxima for a Nonisothermal Chemical System
Housam Binous -
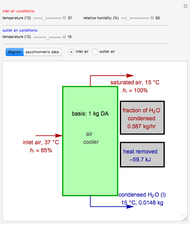 Operation of an Air Conditioner
Housam Binous -
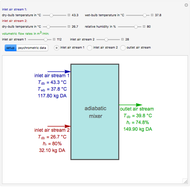 Adiabatic Mixing of Two Moist Air Streams
Housam Binous