Penicillin Production in a Fed-Batch Bioreactor

Requires a Wolfram Notebook System
Interact on desktop, mobile and cloud with the free Wolfram Player or other Wolfram Language products.
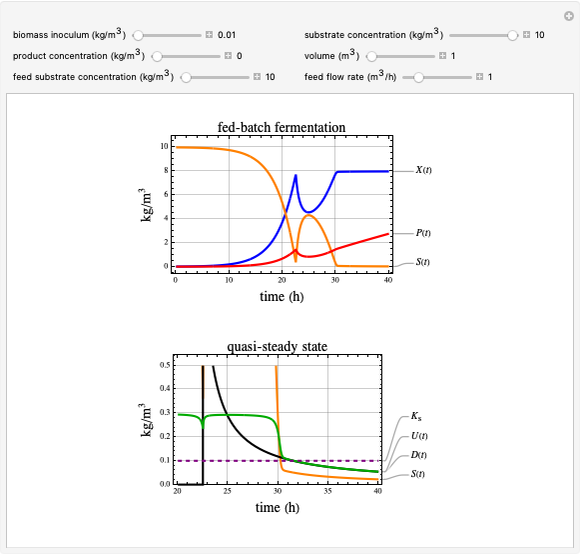
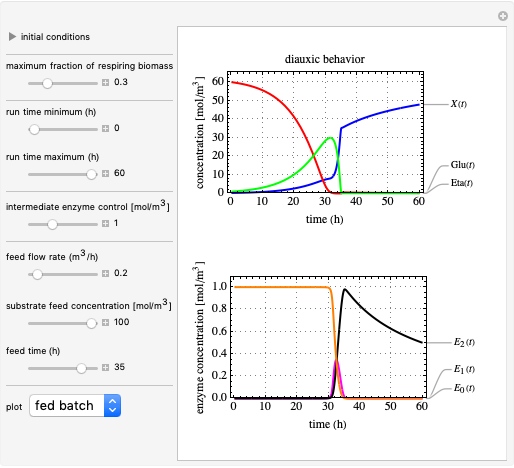
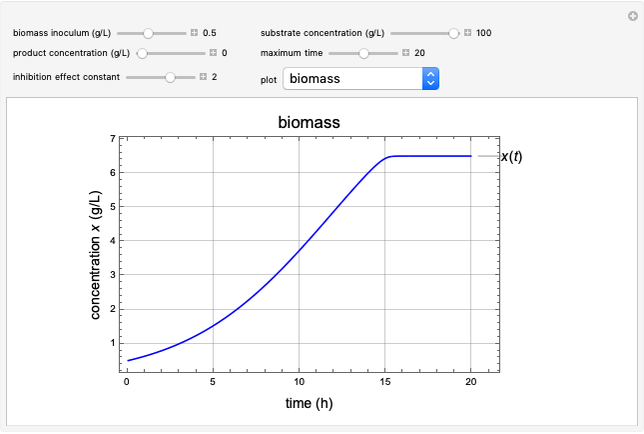
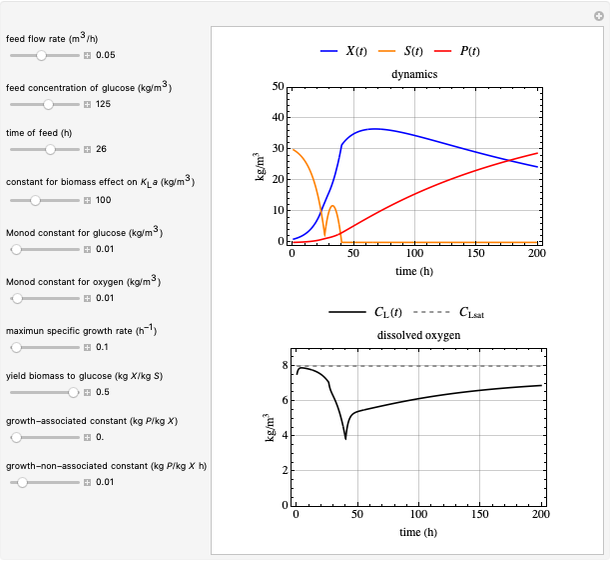
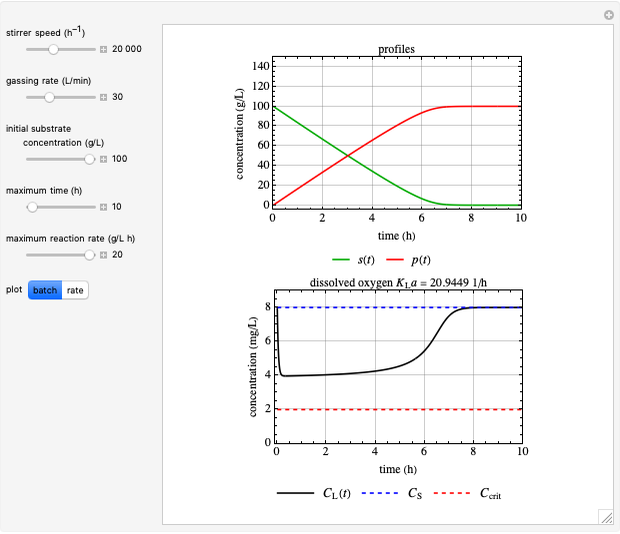
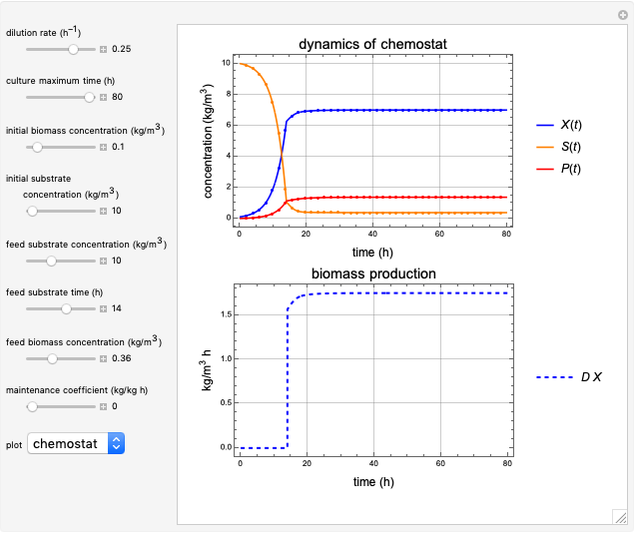
This Demonstration shows the dynamics in a fed-batch reactor that produces penicillin. The influence of oxygen on the growth kinetics is considered.
Contributed by: R. Ricardo Sánchez (August 2022)
Open content licensed under CC BY-NC-SA
Snapshots
Details
The model is described in detail in reference 1.
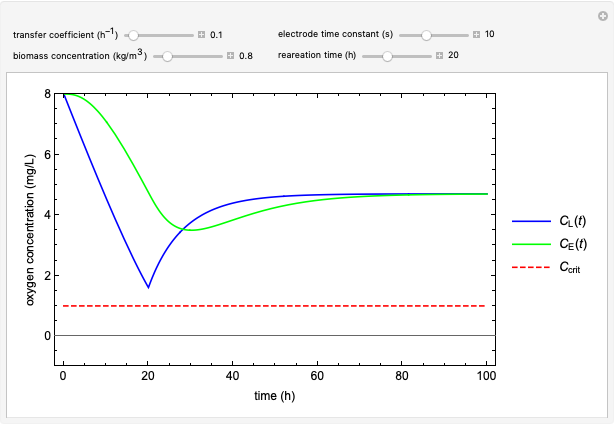
Mass Transfer
The influence of biomass concentration on oxygen transfer is approximated by:
 ,
,
where  describes the biomass effect on
  [1].
[1].
Kinetics
The growth kinetics takes account of oxygen influence:
 .
.
The multiple-substrate Monod kinetics equation describes the influence of substrates. In this way, either substrate may be limiting when the other substrate is present in excess, for example, the requirements on glucose and oxygen in aerobically growing organisms [1].
Penicillin Formation
Fermentation products can be classified according to the relationship between product synthesis and energy generation in the cell. Compounds in the first category are formed directly as end products or byproducts of energy metabolism; these materials are synthesized using pathways that produce ATP (e.g. ethanol and acetic acid). The second class of product is partly linked to energy generation but requires additional energy for synthesis (e.g. citric acid). Formation of other products such as antibiotics (e.g. penicillin) involves reactions far removed from energy metabolism [2]. However, there is no clear direct or indirect coupling to energy generation in the penicillin case [2].
The kinetics of product formation can be exceedingly complex. The product is sometimes formed during growth and sometimes after all growth has ceased. A useful equation for the rate of product formation is the Luedeking–Piret model [1]:

Sometimes  is written
  .
.
Notation
 : substrate concentration (
 ), orange curve
 : biomass concentration (
 ), blue curve
 : penicillin concentration (
 ), red curve
 : oxygen transfer coefficient (1/h)
 : maximum specific growth rate (1/h)
 : specific growth rate (1/h)
 : saturation constant (
 )
)
 : oxygen saturation constant (
 )
)
 : dissolved oxygen concentration (
 ), black curve
 : dissolved oxygen saturation concentration or solubility of oxygen in the broth (
 ), gray dashed line
 : feed flow rate (
 )
)
 : rate of product (penicillin) formation (
 )
)
 : biomass product yield (kg cells/kg product)
 : growth-associated term (kg product/kg cells)
 : non-growth-related term (kg product/kg cells h)
Suggestions for Exploration
Use the "feed flow rate" and "feed concentration" sliders to investigate their influence on the process.
Use the "constant for biomass effect" slider to set different values for  and investigate the influence of
  values on the dissolved oxygen levels.
Try to obtain the maximum amount of product in the shortest time by changing the process parameters (do not change the kinetic parameters).
Vary the sliders for the product kinetic parameters to understand their influence.
References
[1] I. J. Dunn, E. Heinzle, J. Ingham and J. E. Prvenosil, Biological Reaction Engineering: Dynamic Modelling Fundamentals with Simulation Examples, 2nd, completely rev. ed., Weinheim, Germany: VCH Verlagsgesellschaft mbH, 2003.
[2] P. M. Doran, Bioprocess Engineering Principles, 2nd ed., Boston: Academic Press, 2013.
Permanent Citation


