Rovibronic Spectrum of a Parallel Band of a Symmetric Rotor


Requires a Wolfram Notebook System
Interact on desktop, mobile and cloud with the free Wolfram Player or other Wolfram Language products.
This Demonstration shows the rotationally resolved infrared spectrum of a parallel band of a symmetric rotor, with transitions occurring between nondegenerate vibrational levels. Symmetric rotors include ammonia  , benzene
  , and the methyl halides
  , where
  can be
  ,
,  ,
,  , or
, or  ). Symmetric rotors have two equal moments of inertia; the axis with the unique moment of inertia is termed the principle axis. For a symmetric rotor, the direction of the change in dipole moment, or transition moment, determines the appearance of the spectrum because different selection rules must be satisfied. If the transition moment is parallel to the principal axis, as in this Demonstration, a parallel band spectrum results. On the other hand, if the transition moment is perpendicular to the principal axis, a perpendicular band spectrum results. Hybrid bands can result if the transition moment has a component both parallel and perpendicular to the principal axis. For a parallel band, the vibrational selection rules are
  and the rotational selection rules are
  ,
,  if
if  and ,
and ,  ,
,  if
if  , with the restriction that
  . If the complete band spectrum is deconstructed, it appears as a superposition of sub-bands. Each sub-band corresponds to a
  value and consists of a
  branch (
 , ,
, ,  , smaller wavenumbers),
  branch (, , , middle branch, appears when ), and
  branch (, ,
  , larger wavenumbers). Due to the restriction that , with increasing a decreasing number of lines are observed within each sub-band. The observed line intensities reflect a dependence on the thermal population of the ground state energy levels (determined by the Boltzmann factor) and the quantum numbers and
  . With this Demonstration you can view the full spectrum and each branch individually. When viewing each branch individually, you can deconstruct the complete band by choosing which sub-band to highlight and by labeling individual lines/transitions within the sub-band. By using the
  axis lower and upper limit controls, you can zoom in on any region of the spectrum.
Contributed by: Whitney R. Hess and Lisa M. Goss (Idaho State University) (March 2011)
Open content licensed under CC BY-NC-SA
Snapshots


Details
In this Demonstration, ground state constants and quantum numbers are denoted by a double prime (″) superscript and excited state constants and quantum numbers are denoted by a prime (′) superscript.
The mathematical expressions for simulating the spectrum assume that the centrifugal distortion constants  , and the anharmonicity constant,
  are negligible. The interaction of rotation and vibration is taken into account since the ground and excited state values for the rotational constants
  and
and  are not equal (
 and
and  ). However, only a small difference between the ground and excited state values for these constants are used to simulate the spectrum, with
  ,
,  , and
, and  ,
,  . The spectrum is simulated at a temperature of 30 Kelvin.
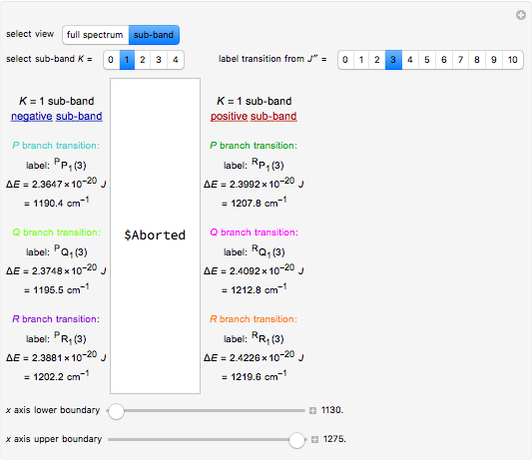
The spectral line corresponding to the chosen transition of interest is indicated by an arrow and labeled by  , with
  ,
,  ,
,  , and
, and  as follows.
: transitions with are designated with  as a superscript, and all transitions in a parallel band fall into this category.
: , , or depends on which branch the line/transition resides.
: the value of  (ground state) is indicated by the subscript.
: the value of  (ground state) is indicated in the parentheses.
For example,  indicates the line corresponding to the
  transition in the branch within the
  sub-band.
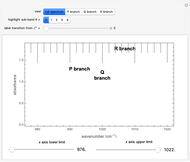
Snapshots 1, 2, 3, and 4: full spectrum, branch, branch, branch views, respectively. The text indicates which sub-band is highlighted and describes the energy levels associated with the chosen transition. The spectral line corresponding to the chosen transition is indicated by an arrow and labeled with the proper transition nomenclature described in this section.
Snapshot 5: with increasing , a decreasing number of lines are observed in the beginning of each branch of a sub-band. For example, in the  branch within the
  sub-band, there are no transitions from
  due to the restriction that .
References
[1] P. Atkins and J. de Paula, Physical Chemistry, New York: Oxford University Press, 2006.
[2] G. Herzberg, Molecular Spectra and Molecular Structure II. Infrared and Raman Spectra of Polyatomic Molecules, Princeton, NJ: D. Van Nostrand Company, Inc., 1945.
Permanent Citation
 Rovibronic Spectrum of a Perpendicular Band of a Symmetric Rotor
Whitney R. Hess and Lisa M. Goss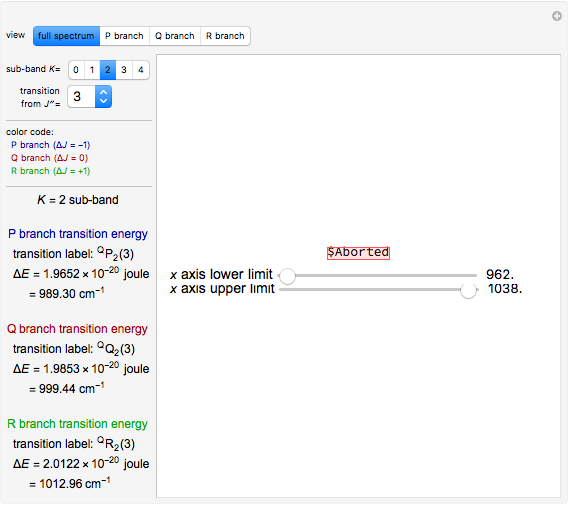 Rotation-Vibration Transitions of a Parallel Band of a Symmetric Rotor
Whitney R. Hess and Lisa M. Goss Rovibronic Infrared Spectrum of a Rigid Diatomic Rotor
Whitney R. Hess and Lisa M. Goss (Idaho State University)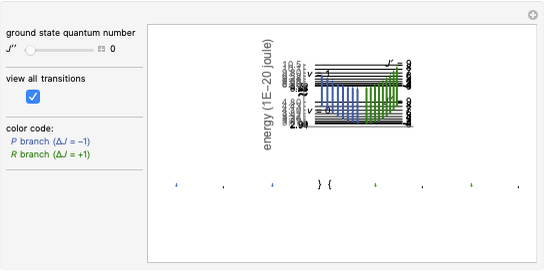 Rotation-Vibration Energy Level Transitions of a Diatomic Rotor
Whitney R. Hess and Lisa M. Goss (Idaho State University)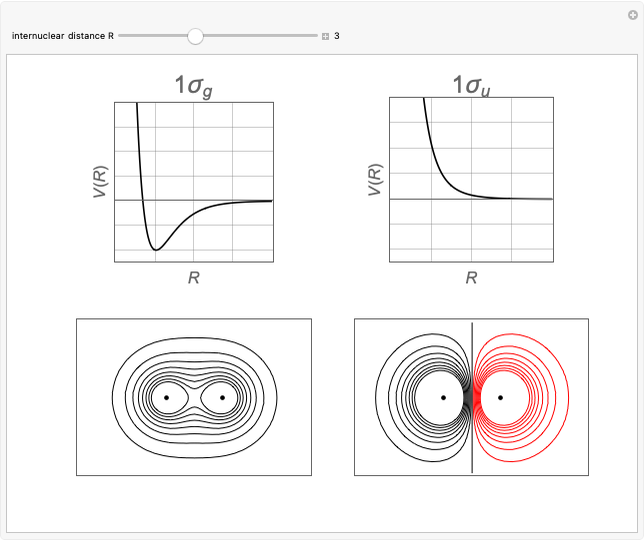 Bonding and Antibonding Molecular Orbitals
S. M. Blinder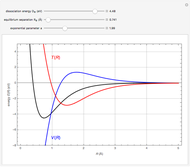 Virial Theorem for Diatomic Molecules
S. M. Blinder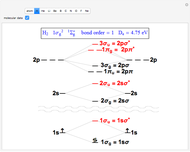 Molecular Orbitals for First- and Second-Row Diatomic Molecules
S. M. Blinder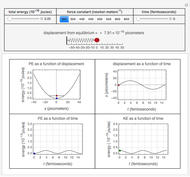 Energy and Position Relationships in Simple Harmonic Motion
Whitney R. Hess and Lisa M. Goss (Idaho State University) Electrostatic Bonding Forces between Atoms
Eric R. Bittner, Department of Chemistry, University of Houston Rate Equations for a Three-Level Model in Low-Dimensional Exciton Systems
Jessica Alfonsi
-
 Rotation-Vibration Transitions for a Perpendicular Band of a Symmetric Rotor
Lisa M. Goss -
Rovibronic Spectrum of a Perpendicular Band of a Symmetric Rotor
Lisa M. Goss -
Rotation-Vibration Transitions of a Parallel Band of a Symmetric Rotor
Lisa M. Goss -
 Rovibronic Spectrum of a Parallel Band of a Symmetric Rotor
Lisa M. Goss -
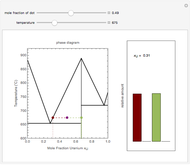 Lever Rule for the Uranium-Titanium Solid-Liquid Phase Diagram
Lisa M. Goss -
Rotation-Vibration Energy Level Transitions of a Diatomic Rotor
Lisa M. Goss -
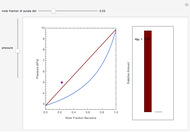
 Lever Rule Applied to Phase Diagram for Partially Miscible Liquids
Lisa M. Goss -
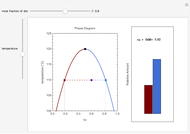
 Lever Rule Applied to the Benzene-Toluene Vapor Pressure Diagram
Lisa M. Goss -
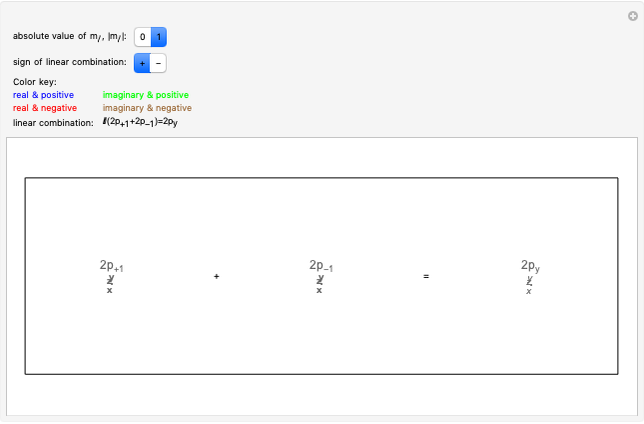 Linear Combinations of p Orbitals
Lisa M. Goss -
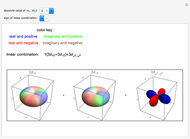
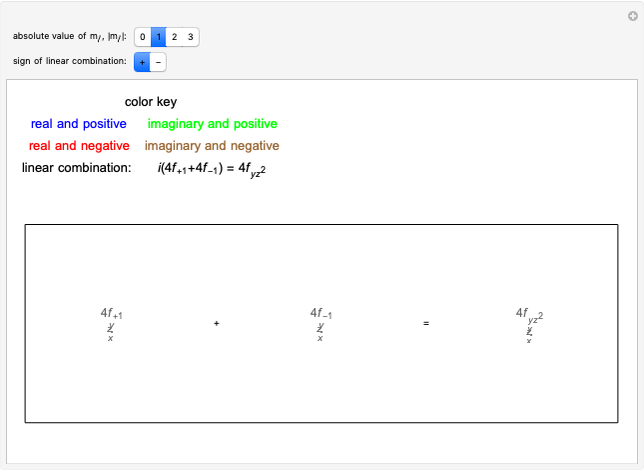 Linear Combinations of f Orbitals
Lisa M. Goss -
 Linear Combinations of d Orbitals
Lisa M. Goss -
Energy and Position Relationships in Simple Harmonic Motion
Lisa M. Goss -
Rovibronic Infrared Spectrum of a Rigid Diatomic Rotor
Lisa M. Goss