Rotation-Vibration Transitions for a Perpendicular Band of a Symmetric Rotor

Requires a Wolfram Notebook System
Interact on desktop, mobile and cloud with the free Wolfram Player or other Wolfram Language products.
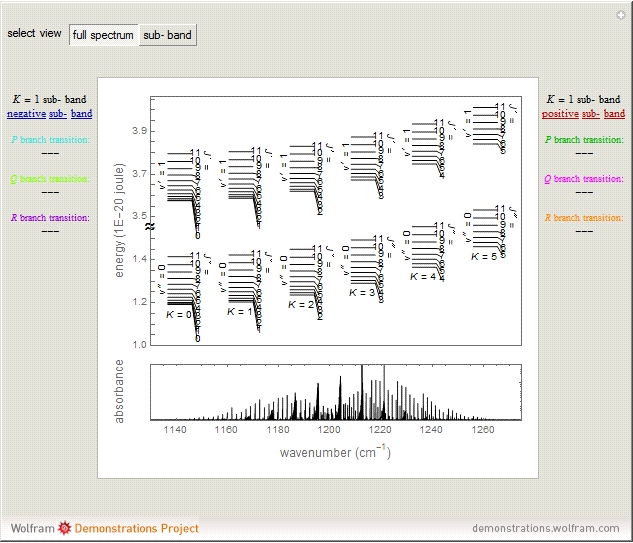
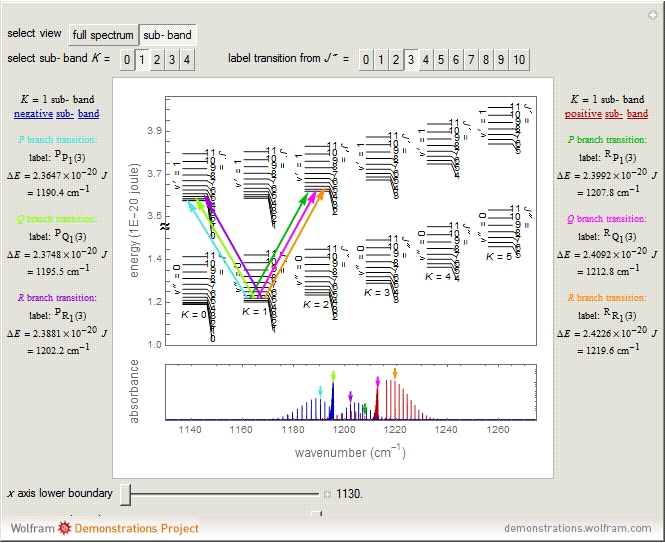
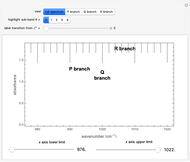
This Demonstration shows the rotation-vibration energy level transitions that correspond to the lines observed in a rotationally resolved infrared spectrum of a perpendicular band of a symmetric rotor. The inherent degeneracy of the vibrational levels (since a symmetric rotor possesses a greater-than-twofold rotation axis) has been neglected in order to maintain clarity in this Demonstration. The transitions occur between nondegenerate vibrational energy levels, and the fundamental vibrational transition is accompanied by rotational transitions in which  .
.


Contributed by: Whitney R. Hess and Lisa M. Goss (August 2011)
(Idaho State University)
Open content licensed under CC BY-NC-SA
Snapshots
Details
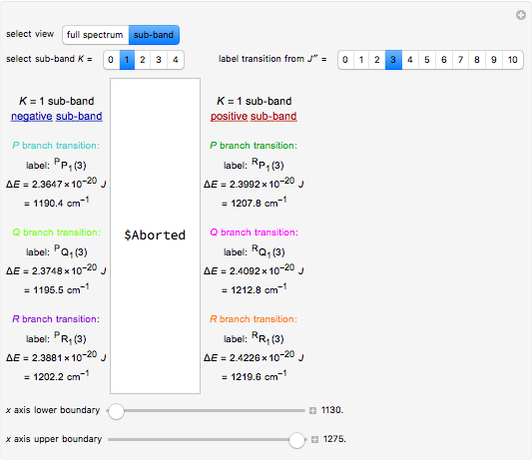
In this Demonstration, a superscript double prime (″) indicates lower state constants and quantum numbers and a superscript prime (′) indicates excited state constants and quantum numbers.
The spectrum in the bottom graphic is simulated at a temperature of 50 Kelvin and with the assumptions that the centrifugal distortion constants and anharmonicity are negligible. Unequal values for the lower and excited state rotational constants  and
and  were used in order to account for the interaction of rotation and vibration
  . The values of
  and
and  were used to simulate the spectrum.
The  axis in the top graphic is arbitrary. The arrows indicating transitions and the energy levels corresponding to each value of
  are spread out along the axis only for clarity.
The transition labels are written as  , where
  ,
,  ,
,  , and
, and  are as follows:
: transitions with  ("positive" sub-bands) are designated with a superscript
  and transitions with
  ("negative" sub-bands) are designated with a superscript
  ;
;
: ,  , or depending on whether
  , respectively;
: the value of  is indicated by the subscript;
: the value of  is enclosed in the parentheses.
For example,  indicates the line corresponding to the
  transition in the branch within the
  "negative" sub-band.
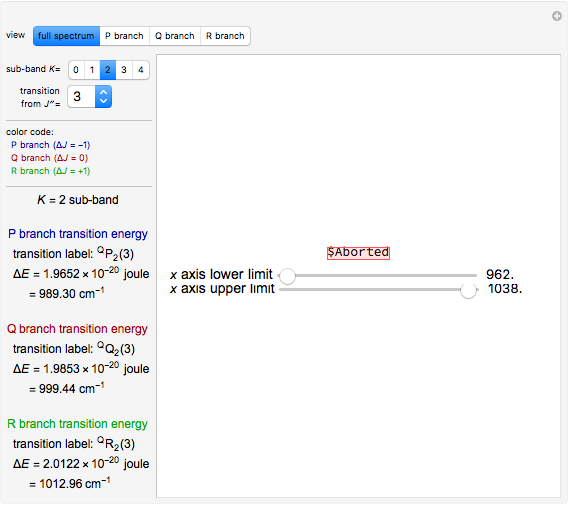
Snapshots 1 and 2: full spectrum (does not utilize the Manipulate functionality) and sub-band views, respectively
Snapshot 3: using the axis lower and upper boundary controls will zoom in on a region of the spectrum and if a transition of interest is outside of the chosen range, the message "transition out of axis range" will appear
Snapshot 4: the separation between the "positive" and "negative" sub-bands becomes larger as a result of the greater difference in the transition energies between the sub-bands as increases
References
[1] P. Atkins and J. de Paula, Physical Chemistry, New York: Oxford University Press, 2006.
[2] G. Herzberg, Molecular Spectra and Molecular Structure II. Infrared and Raman Spectra of Polyatomic Molecules, Princeton, NJ: D. Van Nostrand Company, Inc., 1945.
Permanent Citation
 Rotation-Vibration Transitions of a Parallel Band of a Symmetric Rotor
Whitney R. Hess and Lisa M. Goss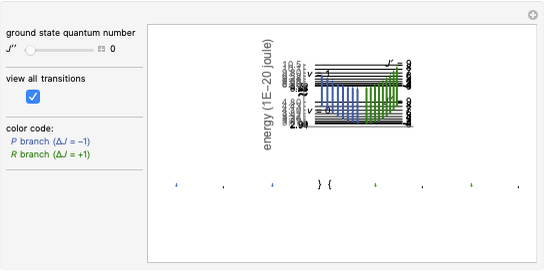 Rotation-Vibration Energy Level Transitions of a Diatomic Rotor
Whitney R. Hess and Lisa M. Goss (Idaho State University)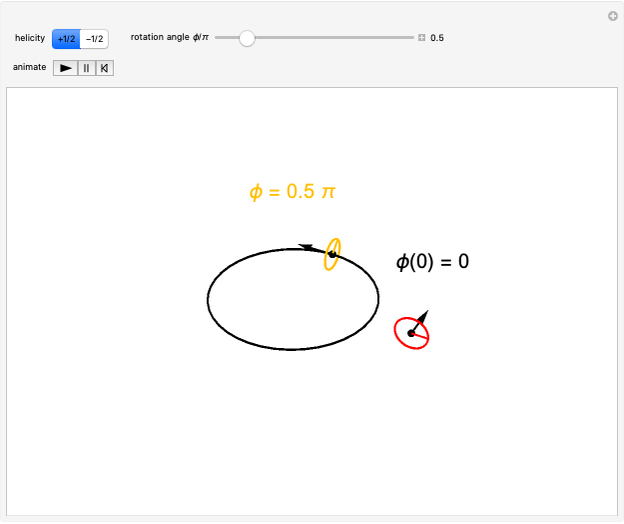 Rotation of Spinors
S. M. Blinder Scattering by a Symmetrical Eckart Potential
S. M. Blinder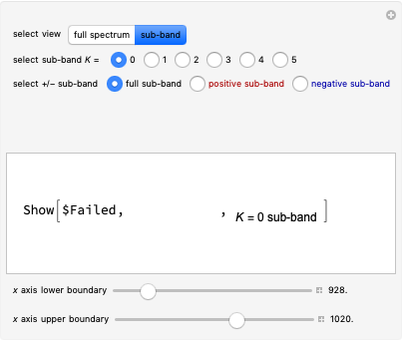 Rovibronic Spectrum of a Perpendicular Band of a Symmetric Rotor
Whitney R. Hess and Lisa M. Goss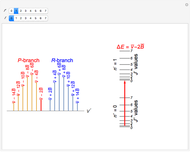 Rotational-Vibrational Spectrum of a Diatomic Molecule
Porscha McRobbie and Eitan Geva Causal Interpretation of Transitions in a Two-Level System
Klaus von Bloh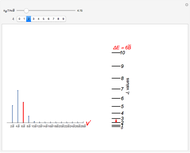 Temperature-Dependent Rotational Energy Spectrum
Porscha McRobbie and Eitan Geva Brillouin Zone of a 2D Square Lattice: Tight Binding Approximation
Vladimir Gavryushin (Vilnius University, Lithuania) Finite Potential Well
Michael R. Braunstein (Central Washington University)
-
 Rotation-Vibration Transitions for a Perpendicular Band of a Symmetric Rotor
Lisa M. Goss -
Rovibronic Spectrum of a Perpendicular Band of a Symmetric Rotor
Lisa M. Goss -
Rotation-Vibration Transitions of a Parallel Band of a Symmetric Rotor
Lisa M. Goss -
 Rovibronic Spectrum of a Parallel Band of a Symmetric Rotor
Lisa M. Goss -
 Lever Rule for the Uranium-Titanium Solid-Liquid Phase Diagram
Lisa M. Goss -
Rotation-Vibration Energy Level Transitions of a Diatomic Rotor
Lisa M. Goss -
 Lever Rule Applied to Phase Diagram for Partially Miscible Liquids
Lisa M. Goss -
 Lever Rule Applied to the Benzene-Toluene Vapor Pressure Diagram
Lisa M. Goss -
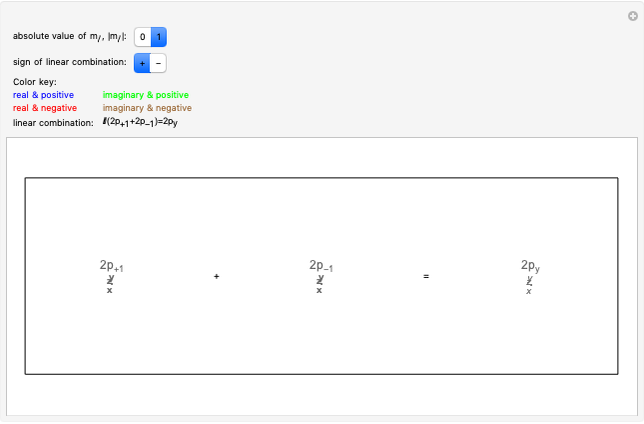 Linear Combinations of p Orbitals
Lisa M. Goss -
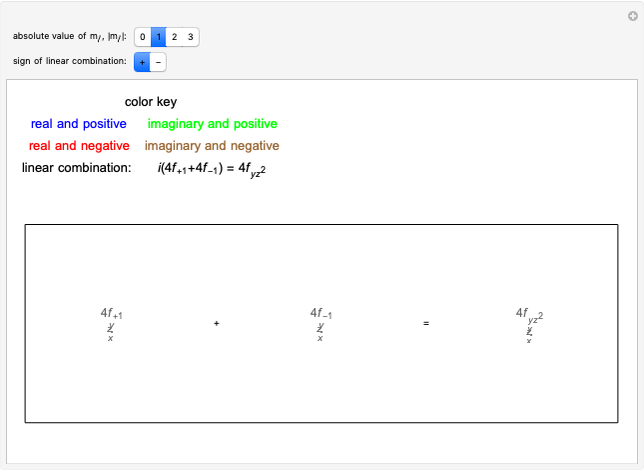 Linear Combinations of f Orbitals
Lisa M. Goss -
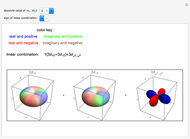 Linear Combinations of d Orbitals
Lisa M. Goss -
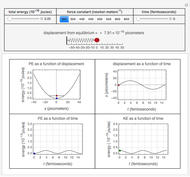 Energy and Position Relationships in Simple Harmonic Motion
Lisa M. Goss -
 Rovibronic Infrared Spectrum of a Rigid Diatomic Rotor
Lisa M. Goss