Simple Nomogram for 95% Confidence Intervals in Small-Sample Binomial Statistics

Requires a Wolfram Notebook System
Interact on desktop, mobile and cloud with the free Wolfram Player or other Wolfram Language products.
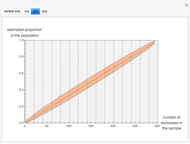
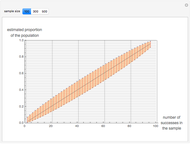
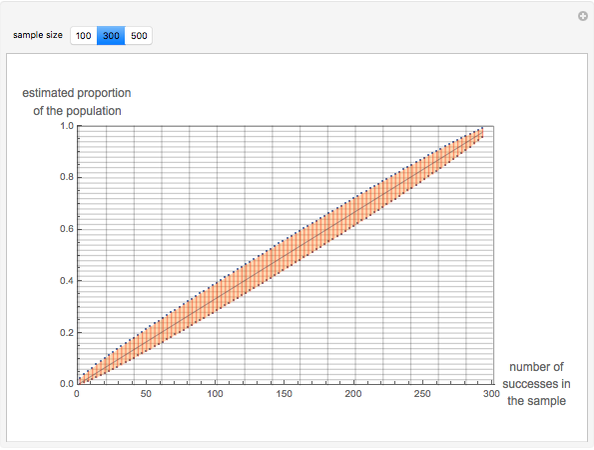
Exact confidence intervals for the proportion parameter in a binomial setup are presented graphically, for a confidence level of 95%. Three examples are shown, corresponding to sample sizes of 100, 300 and 500. Hover the cursor over the points in the graph to see the point estimate, as well as the upper and lower values of the intervals for the possible outcomes of the sampling process.
Contributed by: Tomas Garza (November 2019)
Open content licensed under CC BY-NC-SA
Details
Nomograms are graphical representations of mathematical relationships or laws. A detailed review of this topic appears in [1].
In this Demonstration, a graphical representation is given to provide interval estimates for a small-sample binomial scheme, based on the Clopper–Pearson method [2, 3]. A fixed 95% confidence level is used for the three sample sizes. The performance of the method has been studied in [4].
References
[1] R. Doerfler. "The Art of Nomography I: Geometric Design," Dead Reckonings: Lost Art in the Mathematical Sciences (blog). (Nov 18, 2019) myreckonings.com/wordpress/2008/01/09/the-art-of-nomography-i-geometric-design.
[2] Wikipedia. "Binomial Proportion Confidence Interval." (Nov 18, 2019) en.wikipedia.org/wiki/Binomial_proportion_confidence_interval.
[3] M. Thulin, "The Cost of Using Exact Confidence Intervals for a Binomial Proportion," Electronic Journal of Statistics, 8(1), 2014 pp. 817–840. doi:10.1214/14-EJS909.
[4] T. Garza. "Confidence Intervals, Confidence Levels and Average Interval Length" from the Wolfram Demonstrations Project—A Wolfram Web Resource. demonstrations.wolfram.com/ConfidenceIntervalsConfidenceLevelsAndAverageIntervalLength.
Snapshots


Permanent Citation
 One-Sample t-Test and Confidence Interval with Dot Chart in Small Samples
Douglas Woolford and Ian McLeod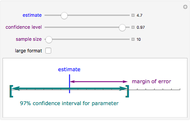 Confidence Intervals: Confidence Level, Sample Size, and Margin of Error
Eric Schulz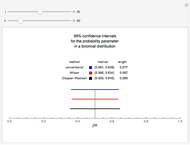 Confidence Intervals for the Binomial Distribution
Tomas Garza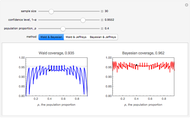 Wald and Bayesian Confidence Intervals
Karl W. Heiner and Stan Wagon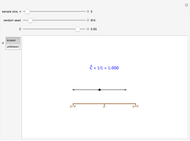 How Do Confidence Intervals Work?
Ian McLeod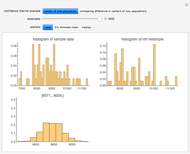 Bootstrap Percentile Confidence Intervals
Sijia Liang and Bruce Atwood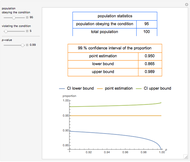 Exact Confidence Intervals for a Single Proportion
Theodora Chatzimichail and Aristides T. Hatjimihail (Aristeidis T. Chatzimichail)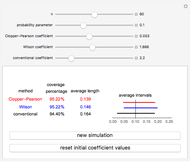 Confidence Intervals, Confidence Levels, and Average Interval Length
Tomas Garza Sampling Statistics and Statistical Estimation
Olexandr Eugene Prokopchenko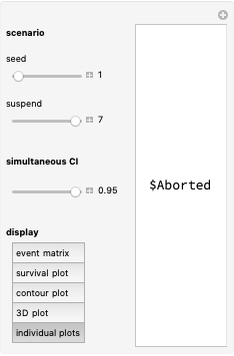 Simultaneous Confidence Interval for the Weibull Parameters
Michail Bozoudis
-
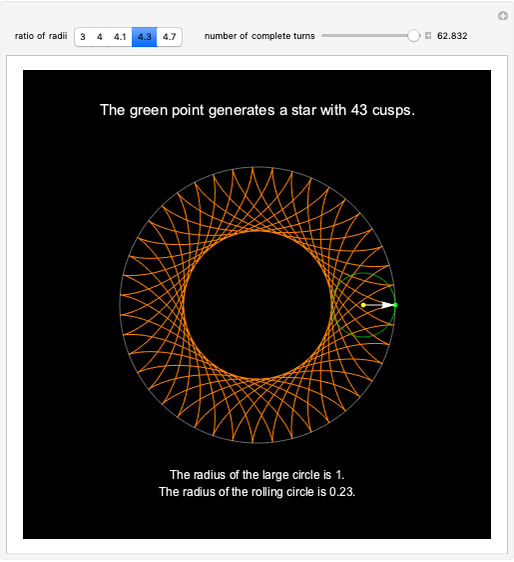 Hypocycloids
Tomas Garza -
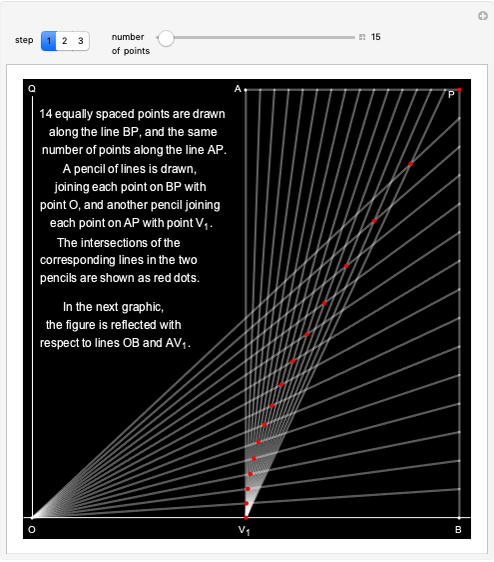 Generating a Hyperbola Using Steiner's Method
Tomas Garza -
 Simple Nomogram for 95% Confidence Intervals in Small-Sample Binomial Statistics
Tomas Garza -
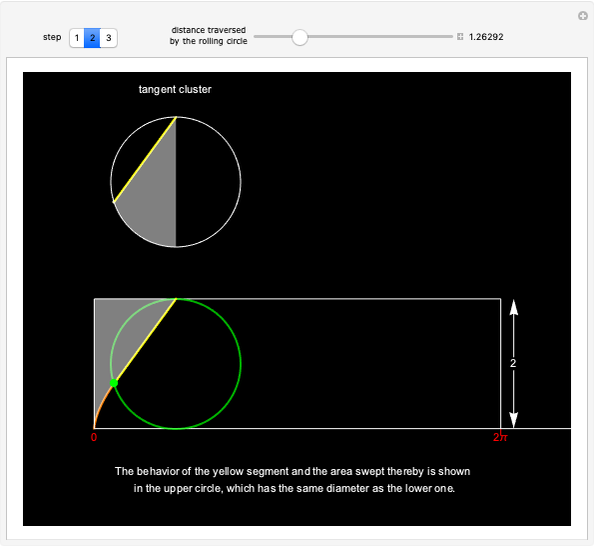 Mamikon's Method for the Area of the Cycloid
Tomas Garza -
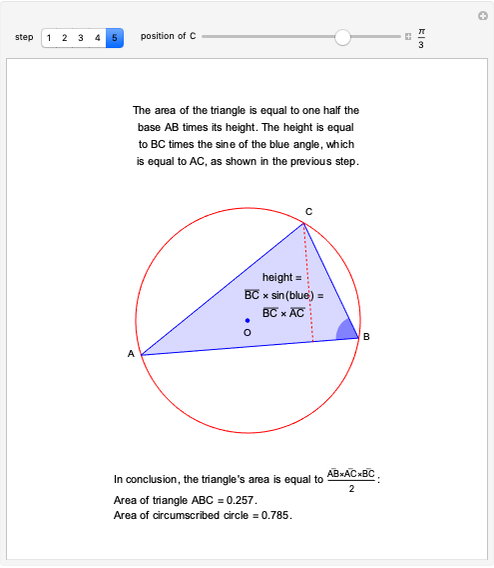 Area of an Inscribed Triangle in Terms of the Product of Its Sides
Tomas Garza -
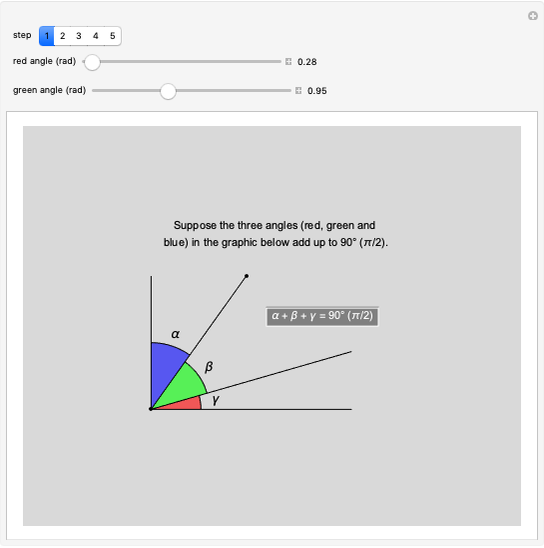 Visual Derivation of a Trigonometric Identity
Tomas Garza -
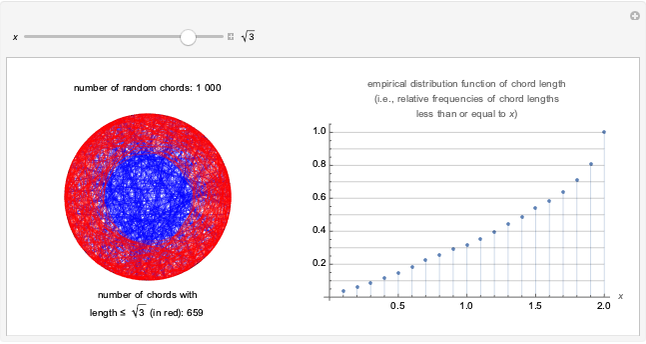 Observed Distribution of Random Chord Lengths in a Circle
Tomas Garza -
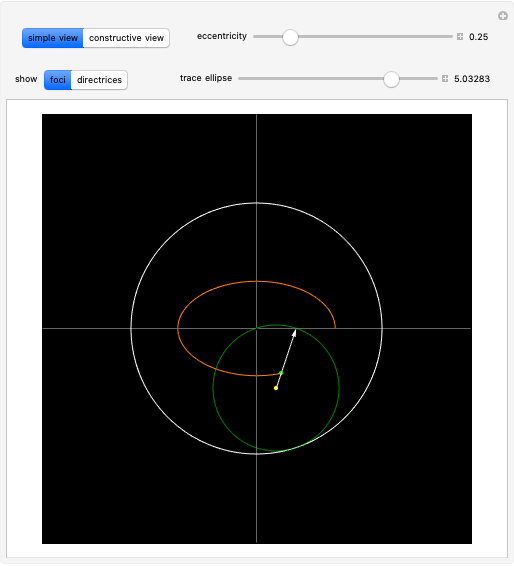 Constructing an Ellipse with a Tusi Couple
Tomas Garza -
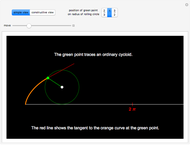 Cycloids and Their Tangents
Tomas Garza -
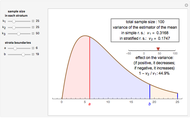 Stratification as a Device for Variance Reduction
Tomas Garza -
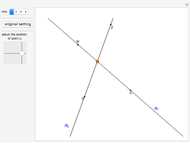 Intersection of Two Lines Using Vectors
Tomas Garza -
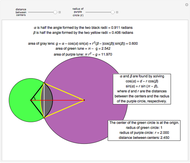 Areas of the Lens and Two Lunes of Two Intersecting Circles
Tomas Garza -
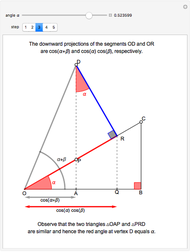 Cosine and Sine of the Sum of Two Angles
Tomas Garza -
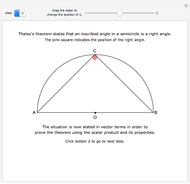 Thales's Theorem: A Vector-Based Proof
Tomas Garza -
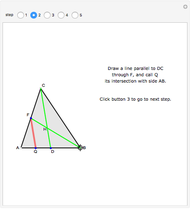
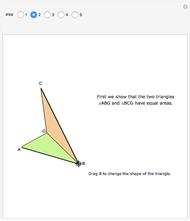 The Medians of a Triangle Divide It into Three Smaller Triangles of Equal Area
Tomas Garza -
 The Medians of a Triangle Are Concurrent: A Visual Proof
Tomas Garza -
 The Centroid of a Triangle Divides Each Median in the Ratio 1:2
Tomas Garza -
 Da Vinci's Proof of the Pythagorean Theorem
Tomas Garza -
Confidence Intervals, Confidence Levels, and Average Interval Length
Tomas Garza -
Confidence Intervals for the Binomial Distribution
Tomas Garza