Statistical Nature of Maxwell-Boltzmann Distribution

Requires a Wolfram Notebook System
Interact on desktop, mobile and cloud with the free Wolfram Player or other Wolfram Language products.
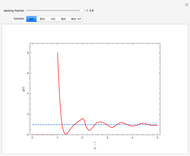
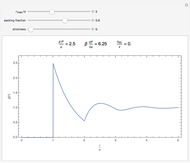
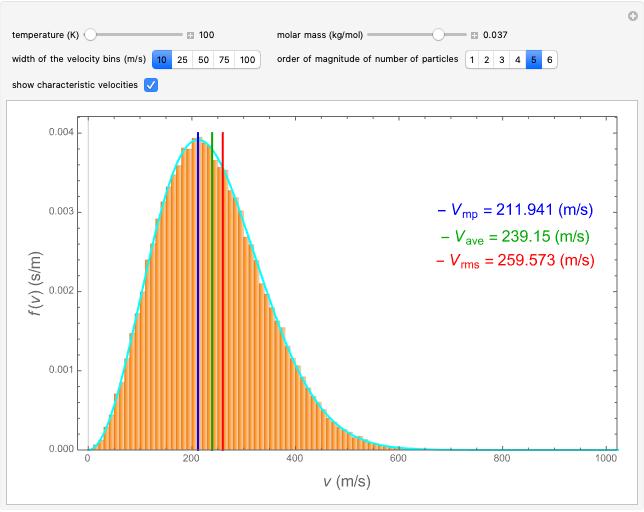
This Demonstration analyzes the statistical nature of the Maxwell–Boltzmann distribution. A histogram of the velocity of the molecules in an ideal gas is shown, with the velocity distribution function  as the
  axis. You can select the order of magnitude of the number of molecules
  . You can change the width of the histogram bins, the temperature and the molar mass to see how the velocity distribution function changes. Also, you can show the mean, average and root mean square velocities.
Contributed by: Fis. Fernando Moncada (August 2022)
(Developed in the Physics Laboratory of Escuela Politécnica Nacional)
Open content licensed under CC BY-NC-SA
Snapshots
Details
The Maxwell–Boltzmann velocity distribution, which describes the speeds of the molecules of an ideal gas, is given by
 ,
,
where  is the molar mass of the ideal gas,
  its temperature,
  the velocity of a given molecule,
  the probability for a given molecule to have a velocity within the range
  , and
, and  is the ideal gas constant. This distribution function is normalized so that
 .
.
The most probable velocity  is found by setting the first derivative with respect to the velocity equal to zero:
 .
.
This is the velocity of the peak of the distribution.
The mean value  of the velocities of this distribution is given by
 .
.
The root mean square velocity  is
is
 .
.
The Maxwell–Boltzmann distribution can be expressed in terms of the most probable velocity by
 .
.
In a simulation with  molecules, the expected number of molecules
  with velocities in the interval
  is related to the distribution function by
 ,
,
where  represents the number of molecules in a given range of velocities (bin of the histogram).
Permanent Citation


