Student's t-Distribution and Its Normal Approximation
Initializing live version


Requires a Wolfram Notebook System
Interact on desktop, mobile and cloud with the free Wolfram Player or other Wolfram Language products.
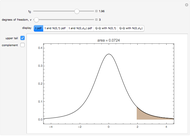
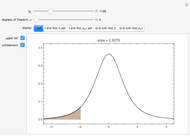
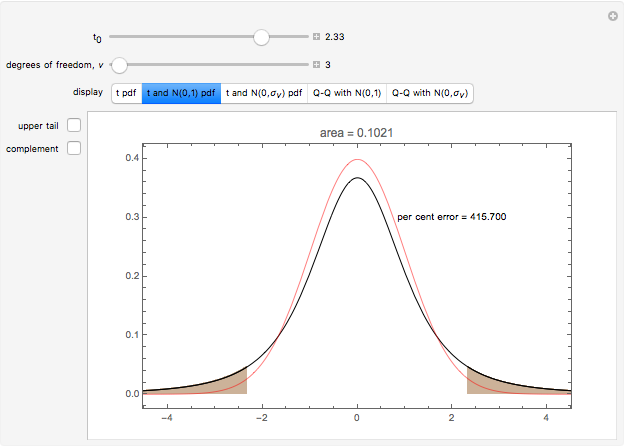
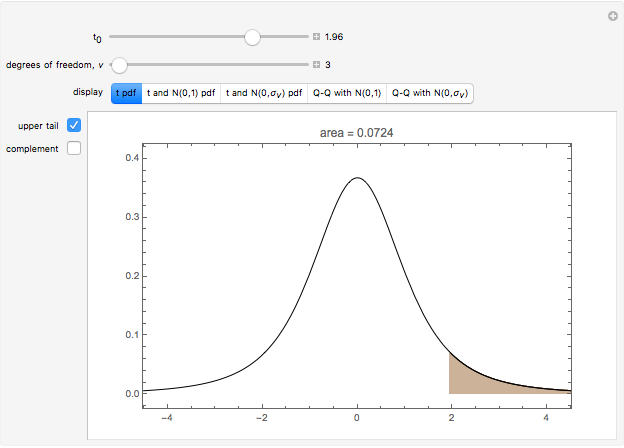
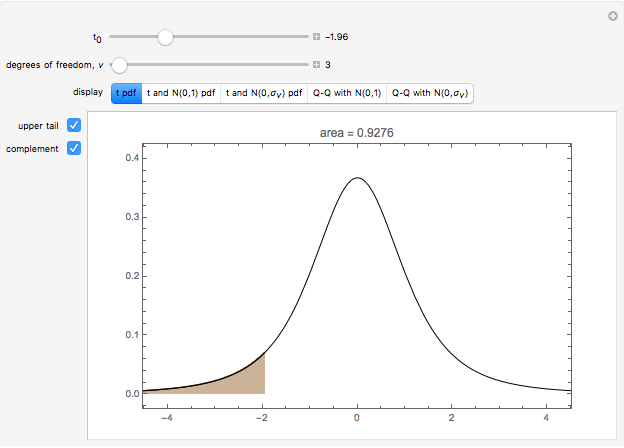
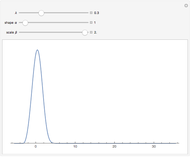
This Demonstration replaces the need for Student  -distribution tables in elementary statistics courses. Critical values for confidence intervals and
  -value computations may be obtained using the first display, "t pdf". The checkbox, "complement" toggles between the tail-area and central-area displays.


Contributed by: Ian McLeod (March 2011)
Open content licensed under CC BY-NC-SA
Snapshots

Details
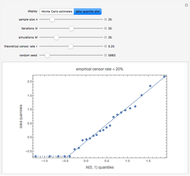
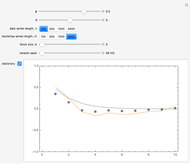
The Q-Q plot for comparing theoretical and empirical distributions is discussed with examples in [1].
[1] W. S. Cleveland, Visualizing Data, Summit, NJ: Hobart Press, 1993.
Permanent Citation
Related Demonstrations
More by Author
 Student's t-Distribution
Chris Boucher The p-Value in One-Sample Tests for the Mean
Ian McLeod Hypothesis Tests about a Population Mean
Chris Boucher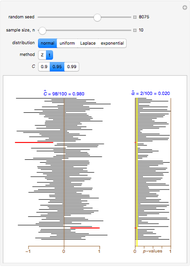 Robustness of Student t in the One-Sample Problem
Ian McLeod Standard Normal Distribution Areas
Ian McLeod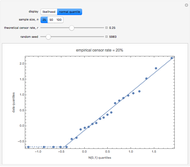 Comparing Exact and Approximate Censored Normal Likelihoods
Ian McLeod and Nagham Muslim Mohammad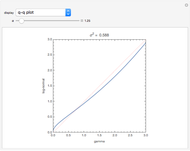 Comparing Gamma and Log-Normal Distributions
Abdelhameed El-Shaarawi, Nagham Muslim Mohammad, and Ian McLeod One-Sample t-Test and Confidence Interval with Dot Chart in Small Samples
Douglas Woolford and Ian McLeod Informal Power Assessment of the Normal Probability Plot
Ian McLeod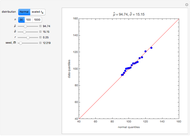 Estimating and Diagnostic Checking in Censored Normal Random Samples
Nagham Muslim Mohammad and Ian McLeod
-
 Rank Transform in Harmonic Regression Time Series
Ian McLeod -
 Detecting Periodicity in Short Time Series
Ian McLeod -
 Tempered Fractionally Differenced White Noise
Ian McLeod -
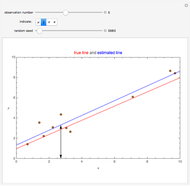
 Regression toward the Mean
Ian McLeod -
 Spread-Location Regression Diagnostic Check
Ian McLeod -
 Anscombe Quartet
Ian McLeod -
 Visualizing Higher-Dimensional Data with 3D Scatterplots
Ian McLeod -
 Mean, Fitted-Value, Error, and Residual in Simple Linear Regression
Ian McLeod -
Estimating and Diagnostic Checking in Censored Normal Random Samples
Ian McLeod -
Comparing Gamma and Log-Normal Distributions
Ian McLeod -
 Monte Carlo Expectation-Maximization (EM) Algorithm
Ian McLeod -
Comparing Exact and Approximate Censored Normal Likelihoods
Ian McLeod -
 Transformation to Symmetry of Gamma Random Variables
Ian McLeod -
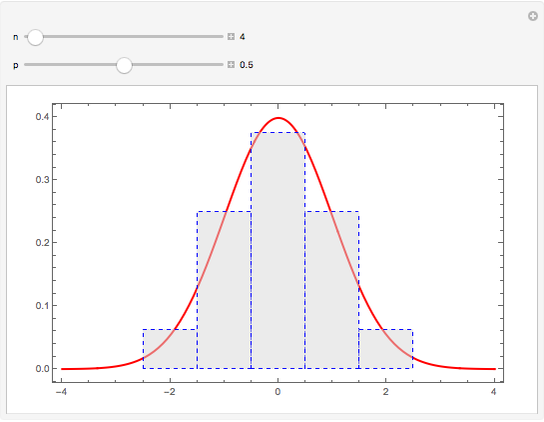 Illustrating the Central Limit Theorem with Sums of Bernoulli Random Variables
Ian McLeod -
 Hidden Correlation in Regression
Ian McLeod -
Informal Power Assessment of the Normal Probability Plot
Ian McLeod -
 Time Series for Power-Law Decay
Ian McLeod -
 Block Bootstrap for Time Series
Ian McLeod -
 Fractional Gaussian Noise
Ian McLeod -
 Plotting a Long Time Series
Ian McLeod