Expected Returns of the Dow Industrials, Beta Model

Requires a Wolfram Notebook System
Interact on desktop, mobile and cloud with the free Wolfram Player or other Wolfram Language products.
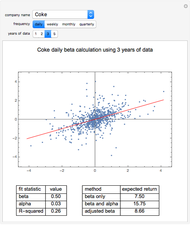
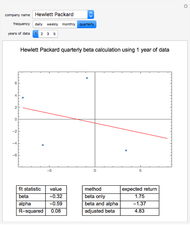
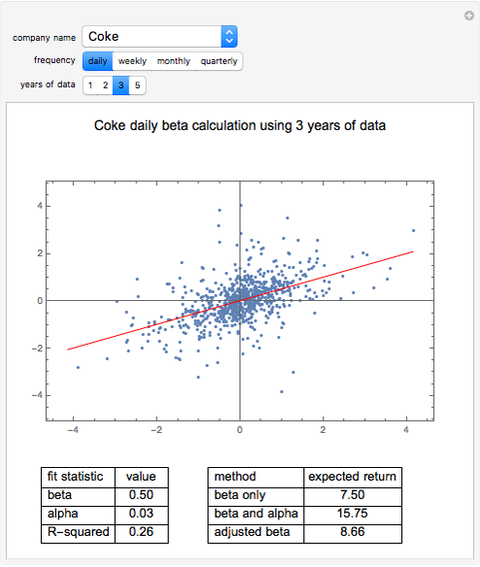
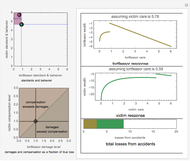
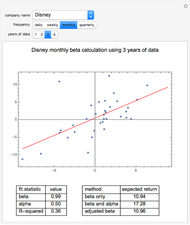
In this Demonstration, we model the expected annual returns of the components of the Dow Jones 30 using the capital asset pricing model (CAPM). We proxy the market returns using the S&P 500 (with dividends reinvested). For the specified return frequency, we display the S&P 500 returns on the  axis and the stock's returns on the
  axis and show the best linear fit. The slope of this line is the beta coefficient, and the intercept is the stock's alpha (with respect to the return frequency).
Contributed by: Jeff Hamrick and Jason Cawley (August 2008)
Open content licensed under CC BY-NC-SA
Snapshots


Details
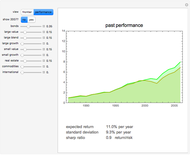
We compute three possible expected returns and display the results in the lower right-hand portion. The expected return computed with beta coefficient only is computed
according to the rule  , where
  is the risk-free rate,
  is the sample beta coefficient of stock
  with respect to the market, and
  is the expected future annual return of the market. We assume that the expected future return in the market will be 11%, which has been the long-term average return of the S&P 500. We use a risk-free rate of 4%.
To compute the expected return "believing both beta and alpha", we use the rule  , where in this case
  is the annualized alpha of the stock . In our analytical framework, a positive
  is generally obtained if the stock outperformed the market over the chosen time period. It is negative if the stock underperformed the market during the chosen time period. If the user partially believes the stock's recent alpha, the user could linearly interpolate the "beta only" and "beta and alpha" results to obtain a partial alpha of sorts.
Sample beta coefficients are notorious for being unstable with respect to: (a) the return frequency used in the analysis; and (b) the particular time window of data used in the analysis. This Demonstration illustrates that instability fairly clearly. Because of this instability, some financial analysts argue that future beta coefficients should be expected to regress to the mean beta coefficient (the beta coefficient of the market with respect to itself, which is one). They instead use an adjusted beta coefficient in their analysis, determined by 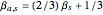 , where
  is the adjusted beta coefficient of stock and again, is the unadjusted beta coefficient of stock . We then compute another possible expected return according to the rule
  .
.
Permanent Citation
 Bilateral Accident Model
Seth J. Chandler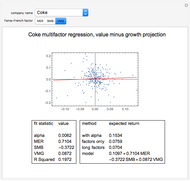 Expected Returns of the Dow Industrials, Fama-French Model
Jeff Hamrick and Jason Cawley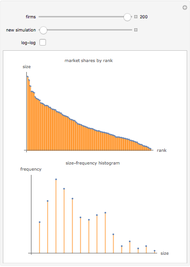 A Model of Market Shares II
Fiona Maclachlan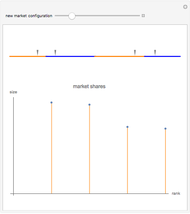 A Model of Market Shares I
Fiona Maclachlan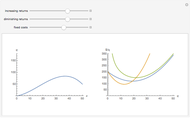 Short-Run Production and Cost Curves
Tom Creahan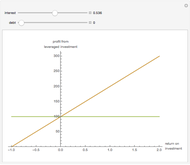 Investment Leverage Effect
Michael Schreiber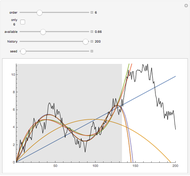 Polynomial Fits of Random Walks
Michael Schreiber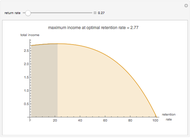 How Much Should I Reinvest in a Business?
Lucas Tsui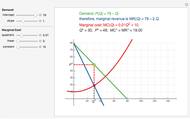 Monopoly Profit-Maximization with Quadratic Marginal Cost
Thomas Mitchell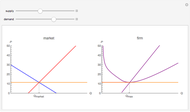 Profit Maximization in Perfect Competition
Fiona Maclachlan
-
 Expected Returns of the Dow Industrials, Beta Model
Jason Cawley -
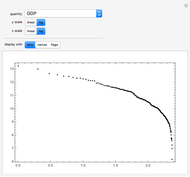
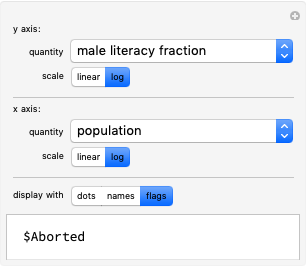 Comparing Data on Countries
Jason Cawley -
 Rank Plots for Countries
Jason Cawley -
 Country Groups
Jason Cawley -
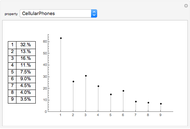 Country Data and Benford's Law
Jason Cawley -
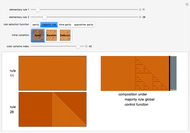 Cellular Automata with Global Control
Jason Cawley -
 Simulating the 2008 U.S. Presidential Election
Jason Cawley -
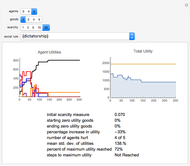 Exploring Social Choice Theory
Jason Cawley -
 Fully Random, Five-Rule Interactive Cellular Automata (ICA)
Jason Cawley -
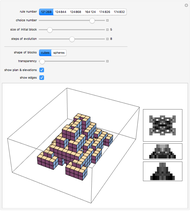 Algorithmic Architecture with Cellular Automata
Jason Cawley -
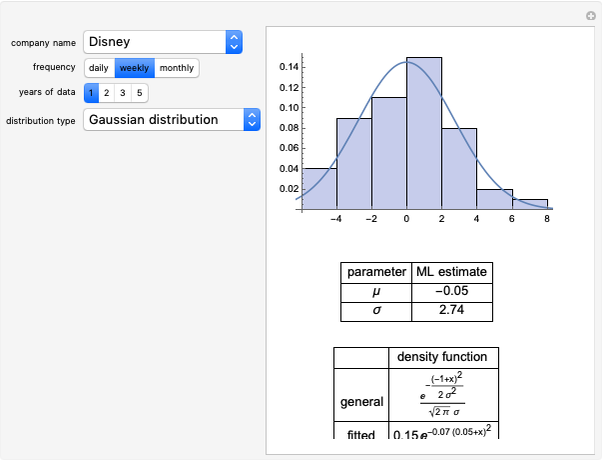 Modeling Return Distributions
Jason Cawley -
Expected Returns of the Dow Industrials, Fama-French Model
Jason Cawley -
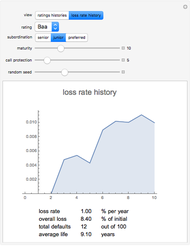 Credit Risk
Jason Cawley -
 Highlighting Patterns in Cellular Automata
Jason Cawley -
 Markov Volatility Random Walks
Jason Cawley -
 Asset Allocation
Jason Cawley -
 Mean-Reverting Random Walks
Jason Cawley -
 An Amoeba Problem
Jason Cawley -
 Totalistic K3 R 1/2 Cellular Automata
Jason Cawley -
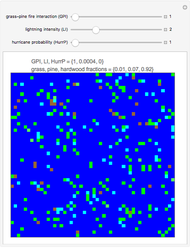 Cellular Automaton Model of Pine Savanna Dynamics in Response to Fire and Hurricanes
Jason Cawley