Modeling Return Distributions

Requires a Wolfram Notebook System
Interact on desktop, mobile and cloud with the free Wolfram Player or other Wolfram Language products.
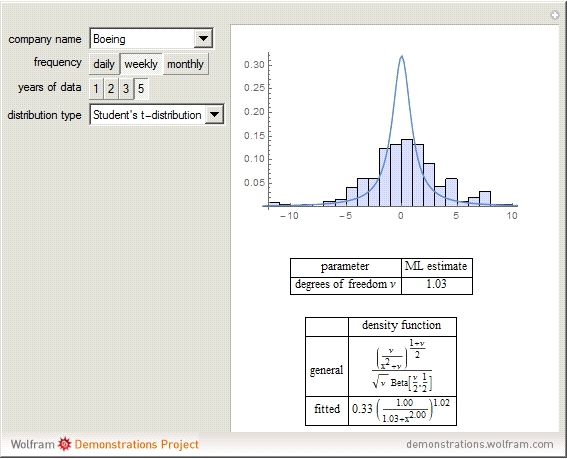
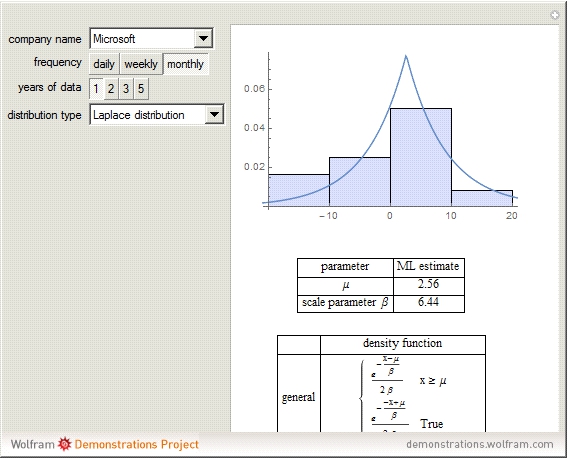
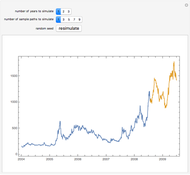
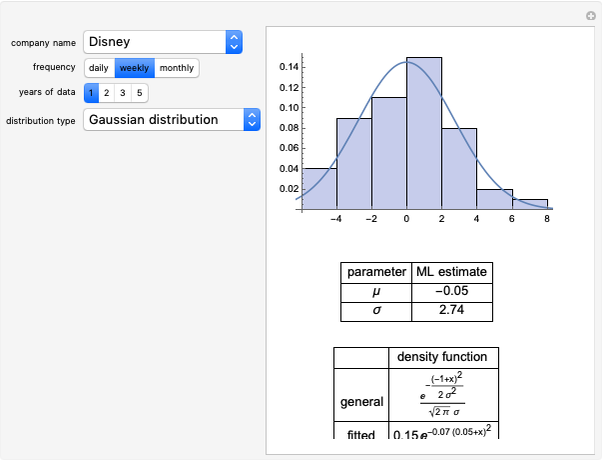
We use numerical maximum likelihood estimation to obtain the parameters governing probability distributions that might plausibly generate the daily, weekly, monthly, or quarterly return distributions of stocks from the Dow 30. The candidate distribution types should probably be continuous and supported on the whole real line. So, we choose to investigate the Gaussian distribution, Student's  -distribution, the Gumbel distribution, the Cauchy distribution, and the Laplace distribution. We show a histogram of the return data for a particular time horizon and frequency, as well as the density function with the fitted parameters.
Contributed by: Jeff Hamrick (March 2011)
Additional contributions by: Jason Cawley
Open content licensed under CC BY-NC-SA
Snapshots
Details
In this Demonstration, we define the returns of a stock  by
by  for
for  . Hence, the number
  corresponds to a positive 5% return and
  corresponds to a negative 9% return.
Permanent Citation
 Expected Returns of the Dow Industrials, Beta Model
Jeff Hamrick and Jason Cawley Expected Returns of the Dow Industrials, Fama-French Model
Jeff Hamrick and Jason Cawley Monte Carlo Simulation of Retirement Savings with Variable Annual Return
Paul Savory (University of Nebraska-Lincoln) The Effect of Holding Period on Real Estate Investment Return
Roger J. Brown Stock Market Returns by Party
Theodore Gray Forming the Efficient Frontier When Returns Are Non-Normal
Roger J. Brown Value Added Growth Model
Roger J. Brown Trader Dynamics in Minimal Models of Financial Complexity
Philip Maymin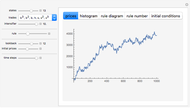 Exploring Minimal Models of the Complexity of Security Prices
Philip Maymin Process-Based Cost Model for Sand-Casting Bronze Bells
Sam Shames
-
Expected Returns of the Dow Industrials, Beta Model
Jeff Hamrick -
 Exploring Measures of Association
Jeff Hamrick -
 Bootstrapping Credit Default Swap Data
Jeff Hamrick -
 Linear Dependence between Two Bernoulli Random Variables
Jeff Hamrick -
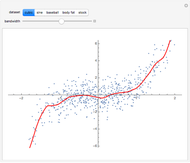 Estimating the Local Mean Function
Jeff Hamrick -
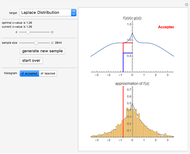 Acceptance/Rejection Sampling
Jeff Hamrick -
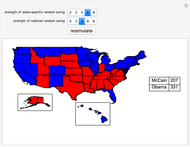 Simulating the 2008 U.S. Presidential Election
Jeff Hamrick -
 The Method of Inverse Transforms
Jeff Hamrick -
 The Perturbed Rat
Jeff Hamrick -
 Modeling Return Distributions
Jeff Hamrick -
 Pricing a European-Style Arithmetic Asian Option: Comparing Bootstrapping and Simulation Approaches
Jeff Hamrick -
 The Method of Common Random Numbers: An Example
Jeff Hamrick -
 The Envelope Theorem: Numerical Examples
Jeff Hamrick -
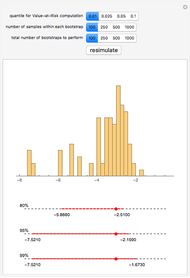 Bootstrapping to Compute Value-at-Risk Standard Errors
Jeff Hamrick -
Expected Returns of the Dow Industrials, Fama-French Model
Jeff Hamrick -
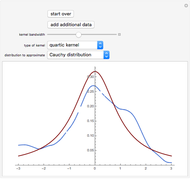 Kernel Density Estimation
Jeff Hamrick -
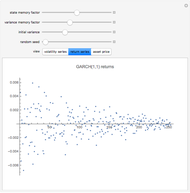 Simulating Asset Prices with a GARCH(1,1) Model
Jeff Hamrick