Expected Returns of the Dow Industrials, Fama-French Model

Requires a Wolfram Notebook System
Interact on desktop, mobile and cloud with the free Wolfram Player or other Wolfram Language products.
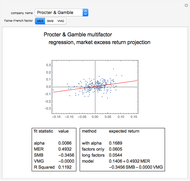
In this Demonstration, we model the expected annual returns of the components of the Dow Jones 30 using the well-known three-factor model of Fama and French. The three factors, which we obtain from Kenneth R. French's web site, are: (1) monthly returns of the market in excess of cash; (2) the average difference between the monthly returns of three portfolios of small-cap stocks and three portfolios of large-cap stocks; and (3) the average difference between the monthly returns of two growth portfolios and two value portfolios.
[more]

Contributed by: Jeff Hamrick and Jason Cawley (March 2011)
Open content licensed under CC BY-NC-SA
Snapshots


Details
Kenneth R. French and his long-time collaborator, Eugene Fama, have produced dozens of articles over the past thirty years that have led to advances in econometrics, mutual fund benchmarking techniques, and factor modeling. We are interested in implementing the famous Fama–French model, using data from French's web site. We obtain monthly returns for the Dow Industrials for the period from June 1988 through June 2008. Using the Fama–French factors from French's web site, we construct multiple linear regression models that explain some of the variation in the monthly stock returns of the Dow 30 in terms of the three Fama–French factors.
The first Fama–French factor, MER for "market excess return", is the market's return during the month less the return on cash for the month. Here, the "market" is defined as the value-weighted average of all stocks on the NASDAQ, NYSE, and AMEX. Fama obtains this data from the Center for Research in Security Prices. Notice that this factor is similar to the single factor used in beta models of expected stock returns.
The second Fama–French factor, SMB for "small minus big", is the average return on three small-cap portfolios minus the average return on three large-cap portfolios. For each market capitalization type, the three portfolios include a value portfolio, blend portfolio, and growth portfolio.
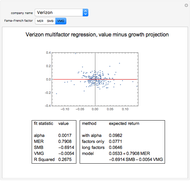
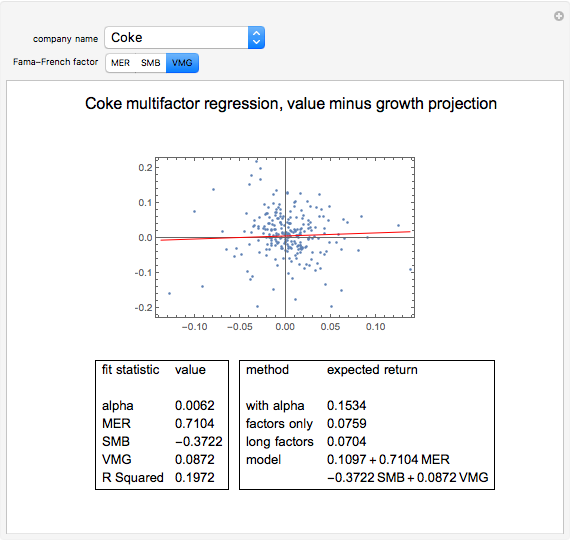
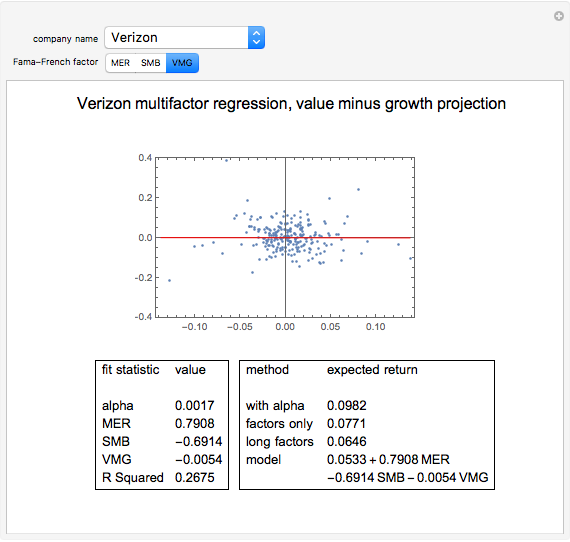
The third Fama–French factor, VMG for "value minus growth", is the average return on two value portfolios minus the average return on two growth portfolios. For each style type, the two portfolios include a large-cap and a small-cap portfolio. Note that the "blend portfolios" are not used to construct this factor.
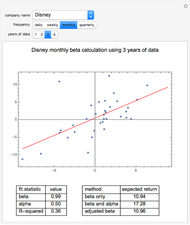
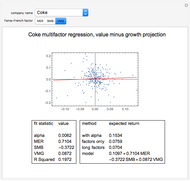
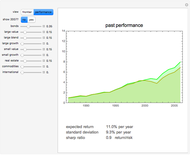
In the bottom left-hand corner of the Demonstration output, we show the fit statistics of the multiple regression model. First, we show the intercept of the regression line, which we call "alpha". We show the regression coefficients associated to MER, SMB, and VMG. Finally, we give the R-squared of the multiple linear regression. Roughly speaking, the R-squared of a multiple regression analysis tells us the percentage of variation in the dependent variable that is explained by the independent variables (in this case, the three Fama–French factors).
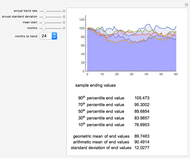
In the bottom right-hand corner of the Demonstration, we show several expected returns that can be derived from this model. The first expected return is computed with expected values for MER, SMB, and VMG obtained from the average of these factors over the past twenty years. It also uses the annualized alpha and a risk-free rate of 3.22%, taken from the current one-year LIBOR. The second expected return ignores alpha—it dismisses the average monthly stock return over the twenty-year period that was in excess of the regression factors. If you "partially believe" in the alpha given by the regression, you could linearly interpolate between the first and second expected values. The third expected return uses expected values for MER, SMB, and VMG taken from the entire available series, back to 1926. Note that SMB was much higher over the whole period than over the past twenty years. Finally, we give a model of the expected annual absolute return for the stock as a function of the expected or forecasted factors. The intercept in this model incorporated both the annualized alpha and the risk-free rate; substitute your own intercept if you do not believe the historical alpha or want to use a different risk-free rate.
Choosing a particular stock and Fama–French factor produces a scatter plot of the stock's excess returns over cash versus the chosen factor, as well as the projection of the multidimensional fit onto that plane. Notice that most of the stocks in our sample are more correlated with MER than the other factors. Because the Dow Jones Industrial Average is composed of large-cap stocks, most have excess returns that are negatively correlated with SMB. Over the twenty-year period featured in our analysis, VMG is more often positive than negative, meaning that value stocks outperformed growth stocks.
The Fama–French model is only one possible multifactor model that could be used to explain excess (or absolute) stock returns. The source code in this Demonstration could be modified to support another set of independent variables. Some other factors that researchers have used include fundamental indicators like the P/E ratio or price-to-cash-flow ratio, macroeconomic variables like GDP growth, or technical indicators like relative strength or volume.
Permanent Citation
"Expected Returns of the Dow Industrials, Fama-French Model"
http://demonstrations.wolfram.com/ExpectedReturnsOfTheDowIndustrialsFamaFrenchModel/
Wolfram Demonstrations Project
Published: March 7 2011
 Expected Returns of the Dow Industrials, Beta Model
Jeff Hamrick and Jason Cawley Polynomial Fits of Random Walks
Michael Schreiber Modeling Return Distributions
Jeff Hamrick Bootstrapping Credit Default Swap Data
Jeff Hamrick Merton's Jump Diffusion Model
Andrzej Kozlowski The Return Distribution of the Variance Gamma Process
Andrzej Kozlowski Simulating the IRR
Roger J. Brown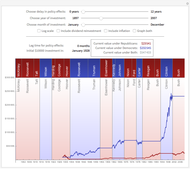 Stock Market Returns by Party
Theodore Gray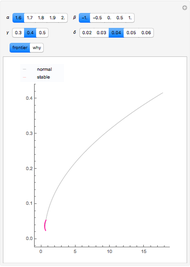 Forming the Efficient Frontier When Returns Are Non-Normal
Roger J. Brown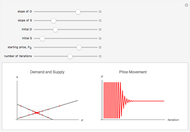 Cobweb Model
Samuel G. Chen
-
Expected Returns of the Dow Industrials, Beta Model
Jason Cawley -
 Comparing Data on Countries
Jason Cawley -
 Rank Plots for Countries
Jason Cawley -
 Country Groups
Jason Cawley -
 Country Data and Benford's Law
Jason Cawley -
 Cellular Automata with Global Control
Jason Cawley -
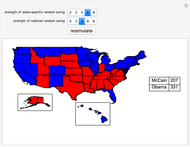 Simulating the 2008 U.S. Presidential Election
Jason Cawley -
 Exploring Social Choice Theory
Jason Cawley -
 Fully Random, Five-Rule Interactive Cellular Automata (ICA)
Jason Cawley -
 Algorithmic Architecture with Cellular Automata
Jason Cawley -
Modeling Return Distributions
Jason Cawley -
 Expected Returns of the Dow Industrials, Fama-French Model
Jason Cawley -
 Credit Risk
Jason Cawley -
 Highlighting Patterns in Cellular Automata
Jason Cawley -
 Markov Volatility Random Walks
Jason Cawley -
 Asset Allocation
Jason Cawley -
 Mean-Reverting Random Walks
Jason Cawley -
 An Amoeba Problem
Jason Cawley -
 Totalistic K3 R 1/2 Cellular Automata
Jason Cawley -
 Cellular Automaton Model of Pine Savanna Dynamics in Response to Fire and Hurricanes
Jason Cawley