Mean-Reverting Random Walks


Requires a Wolfram Notebook System
Interact on desktop, mobile and cloud with the free Wolfram Player or other Wolfram Language products.
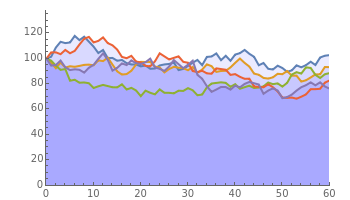
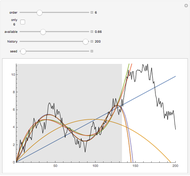
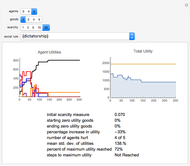
Many financial or economic processes can be modeled as mean-reverting random walks. Mean-reverting walks differ from simple diffusion by the addition of a central expectation, usually growing with time, and a restoring force that pulls subsequent values toward that expectation. The random term is lognormally distributed, and the initial value of the mean can be above or below the series start. The strength of the restoring force is given in terms of the time to return to the mean. The plot shows sample paths which result in the  ,
,  ,
,  ,
,  , and
, and  percentiles in endpoint value, out of a larger sample.
Contributed by: Jason Cawley (March 2011)
Open content licensed under CC BY-NC-SA
Snapshots


Details
Rates are given in annual percentage terms, while the path lengths, mean reversion rate, and individual steps are given in months.
The series always starts from an index level of 100. The central tendency "mean" can start above or below the index itself.
The annual standard deviation is given for the random component of the process. In general, the actual measured standard deviation of the mean-reverting process will be less than this value, and can be substantially below it for fast relaxation times and high standard deviation.
The random component of the process is lognormally distributed, so proportional changes higher or lower are equally likely, while absolute changes are skewed.
The mean moves deterministically at the trend rate, and attracts subsequent terms in the series more strongly when the series is farther from that mean. The relaxation time parameter, months to trend, controls how strongly this term acts.
A relaxation time of infinity turns the process into a lognormal random walk with a trend rate. The level of the initial mean has no effect in that case.
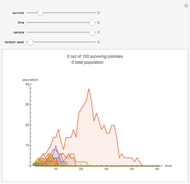
A sample of 100 runs is generated and ranked by ending value. The series actually displayed are those at the , , , , and percentiles in this sample.
Shading accumulates from the upper series to the lower, giving a rough idea of the probability of reaching various values.
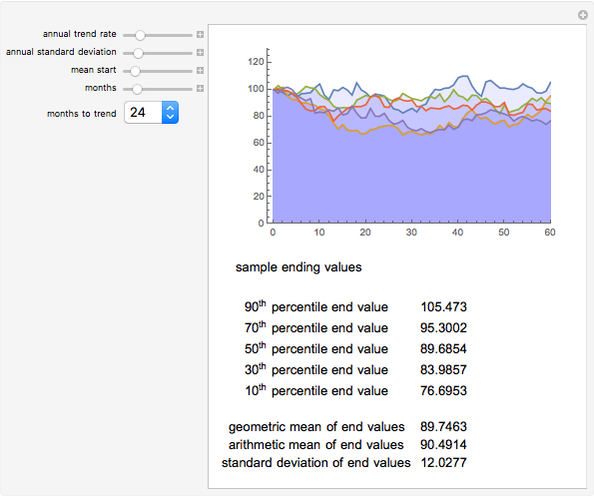
The table of values below the plot gives the ending values in the sample, for the same series plotted above. Means and standard deviation of the ending values are also given. Note that this standard deviation is not an annual figure, but the measured, absolute standard deviation of the ending values only, in index points.
The default snapshot uses typical parameters for a broad stock index, assuming a modest initial overvaluation (mean lower than series start).
The next snapshot uses typical parameters for a real estate series, assuming a slow rate of appreciation and a substantial initial overvaluation.
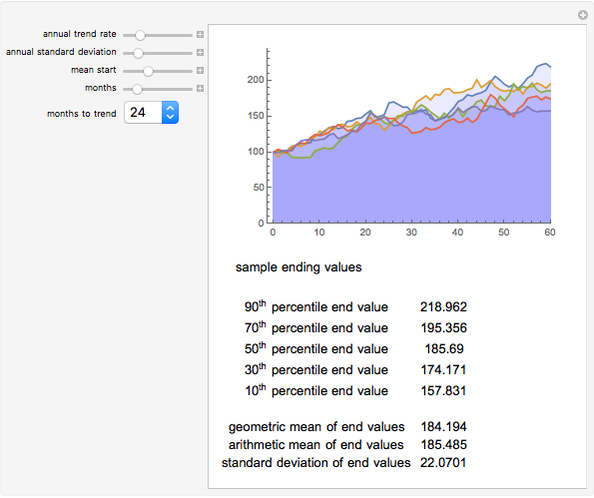
The next snapshot uses the same parameters as the previous, but this time with an initial undervaluation.
The next uses the typical stock index values again, this time starting from a modest undervaluation.
The last snapshot uses a high volatility, zero trend, and infinite relaxation time, thus giving a lognormal random walk with no trend or mean reversion.
Note that on short time scales, lognormal random walks without any mean reversion term can be good models of securities prices. On longer time scales, mean reversion becomes more common, and it is also more common in macroeconomic series (e.g., corporate profits, anchored around a trend rate set by growth of the money supply).
Permanent Citation
 Polynomial Fits of Random Walks
Michael Schreiber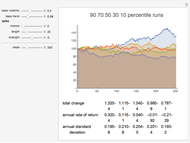 Markov Volatility Random Walks
Jason Cawley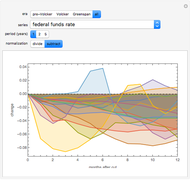 Macroeconomic Effects of Interest Rate Cuts
Jason Cawley and Fred Meinberg (Wolfram Research)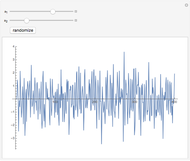 Auto-Regressive Simulation (Second-Order)
David von Seggern (University of Nevada)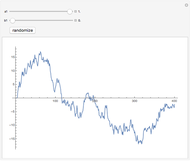 Autoregressive Moving-Average Simulation (First Order)
David von Seggern (University of Nevada)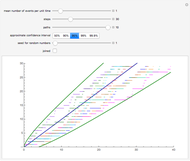 Simulating the Poisson Process
Heikki Ruskeepää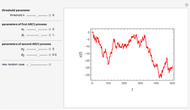 Two-Regime Threshold Autoregressive Model Simulation
Jozef Barunik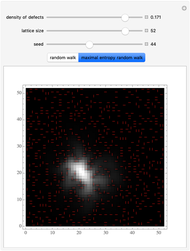 Generic Random Walk and Maximal Entropy Random Walk
Bartlomiej Waclaw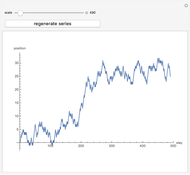 Self-Similarity in Random Walk
Hiroki Sayama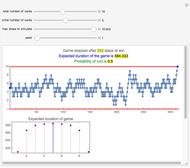 A Reluctant Random Walk
Heikki Ruskeepää
-
 Expected Returns of the Dow Industrials, Beta Model
Jason Cawley -
 Comparing Data on Countries
Jason Cawley -
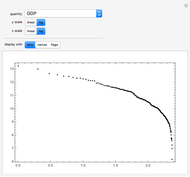 Rank Plots for Countries
Jason Cawley -
 Country Groups
Jason Cawley -
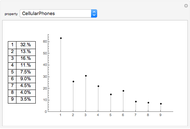 Country Data and Benford's Law
Jason Cawley -
 Cellular Automata with Global Control
Jason Cawley -
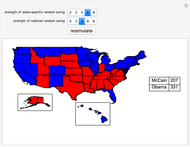 Simulating the 2008 U.S. Presidential Election
Jason Cawley -
 Exploring Social Choice Theory
Jason Cawley -
 Fully Random, Five-Rule Interactive Cellular Automata (ICA)
Jason Cawley -
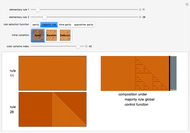
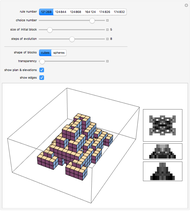 Algorithmic Architecture with Cellular Automata
Jason Cawley -
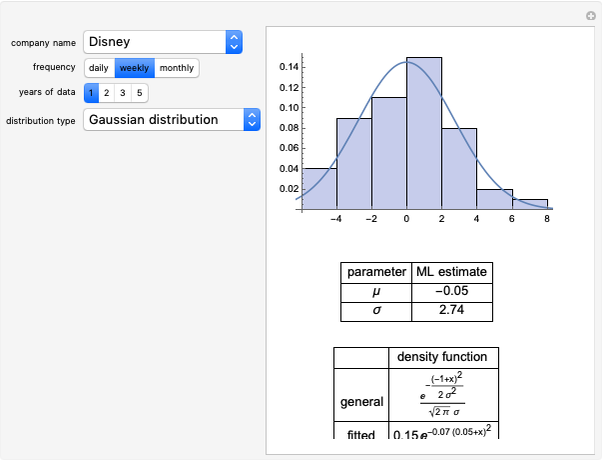 Modeling Return Distributions
Jason Cawley -
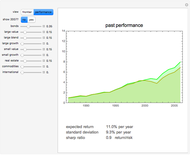
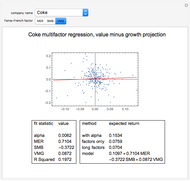 Expected Returns of the Dow Industrials, Fama-French Model
Jason Cawley -
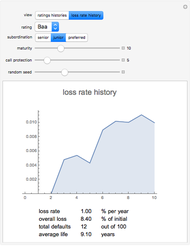 Credit Risk
Jason Cawley -
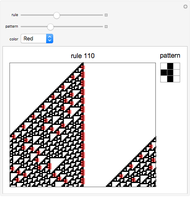 Highlighting Patterns in Cellular Automata
Jason Cawley -
Markov Volatility Random Walks
Jason Cawley -
 Asset Allocation
Jason Cawley -
 Mean-Reverting Random Walks
Jason Cawley -
 An Amoeba Problem
Jason Cawley -
 Totalistic K3 R 1/2 Cellular Automata
Jason Cawley -
 Cellular Automaton Model of Pine Savanna Dynamics in Response to Fire and Hurricanes
Jason Cawley