Simulating the 2008 U.S. Presidential Election

Requires a Wolfram Notebook System
Interact on desktop, mobile and cloud with the free Wolfram Player or other Wolfram Language products.
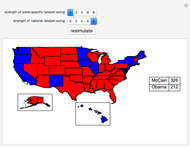
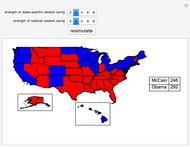
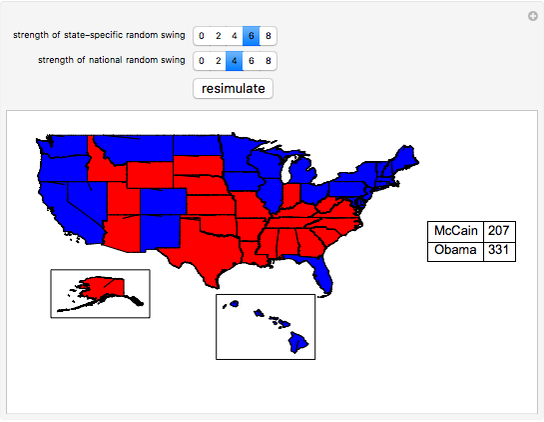
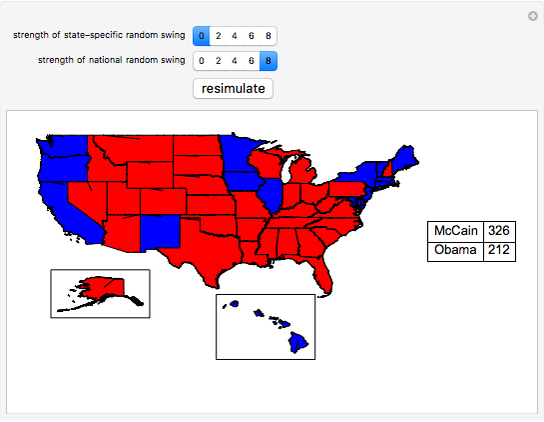
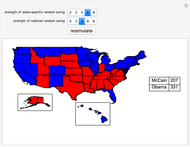
We use recent polling data (current as of the middle of August 2008) to simulate the results of the upcoming November 2008 U.S. presidential election. We focus on the allocation of votes in the Electoral College rather than the popular vote. To generate a simulation, press the "resimulate" button, change the strength of state-specific polling effects, or change the strength of a national random swing in the polls between now and election day.
[more]
Contributed by: Jeff Hamrick, Fred Meinberg, and Jason Cawley (April 2011)
Open content licensed under CC BY-NC-SA
Snapshots


Details
The polling data for this Demonstration is taken from Electoral-vote.com, which averages all reasonably reliable state-by-state polling results that were published within the last week (though in states like Idaho, where little polling is ever done, the web site uses very stagnant polling data). This Demonstration uses the polling data available at the approximate time of initial publication, and the authors will try to update the polling data periodically prior to the election in November. Feel free to download the Demonstration and change the polling data in particular states to results that you find to be more suitable.
The simulation does not account for other longer-term factors that tend to influence voting results—factors like race, religion, income level, education, etc. Additionally, the polls used to aggregate smoother polling results at Electoral-vote.com include both polls of "likely voters" (voters who say they will actually vote, and who have voted in recent elections) and registered voters. Polls of registered voters tend to favor Democratic candidates, since Democratic candidates often orchestrate voter registration drives that may or may not result in voters actually showing up at the polls on election day.
First, we generate a random Gaussian number with standard deviation equal to half of whatever the user chooses as the "strength of national random swing". Half of this result (which can be a positive or negative number) is added to Obama's polling number in each state and the same number is subtracted from McCain's polling number in each state. Again, since the random Gaussian can be negative, subtracting a negative number would have the consequence of improving McCain's polling numbers in the state. The net effect of this procedure is to widen or narrow the current gap between the candidates in each state in exactly the same way (hence it is a "national" effect) between now and election day.
The new polling data is then subjected to a rule, which we term the "strength of state-specific random swing". Let  be the strength of the state-specific random swing. If the user selects
  , then the state's electoral votes are awarded to the current leader in the polls, using the new polling data. If the user selects
  , then the state's electoral votes are awarded to the current poll leader only if the new polling data in the state shows the polling leader leading by five or more points.
If the difference between the percentage of voters favoring Obama and McCain is less than (again, using the new polling data), then the state's electoral votes are randomly assigned to Obama with probability 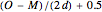 , where
  and
and  are the recent polling results for Obama and McCain, respectively.
To obtain landslide effects, make the national random swing variable higher rather than lower. To obtain noisy results on a state-by-state basis, make the national random swing variable relatively small and make the state-specific random swing relatively large.
Notice that the polling results in each state do not add up to 100% because some voters are undecided. We also ignore the possible splitting of Maine or Nebraska's electoral votes.
Permanent Citation
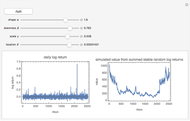 Stock Price Simulation Using Stable Random Variables
Bob Rimmer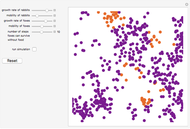 Predator-Prey Ecosystem: A Real-Time Agent-Based Simulation
Hiroki Sayama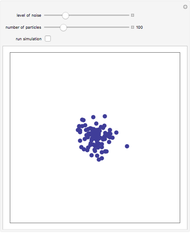 Random Walk and Diffusion of Many Independent Particles: An Agent-Based Simulation
Hiroki Sayama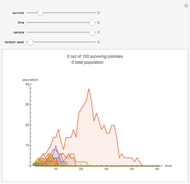 An Amoeba Problem
Jason Cawley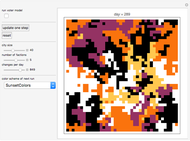 Voter Model
Ed Pegg Jr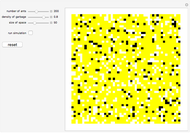 Garbage Collection by Ants
Hiroki Sayama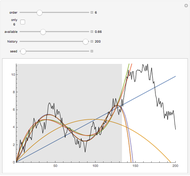 Polynomial Fits of Random Walks
Michael Schreiber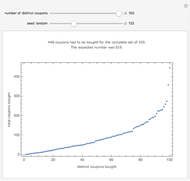 Coupon Collector Problem
Ed Pegg Jr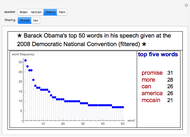 The 2008 Convention Speeches
Abigail Nussey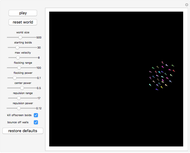 Boids: Simulated Flocking Behavior
Steven H. Wang
-
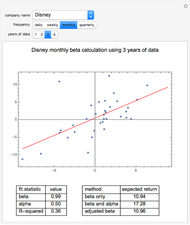 Expected Returns of the Dow Industrials, Beta Model
Jason Cawley -
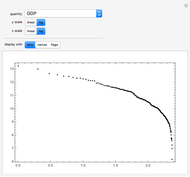
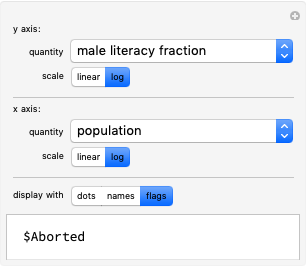 Comparing Data on Countries
Jason Cawley -
 Rank Plots for Countries
Jason Cawley -
 Country Groups
Jason Cawley -
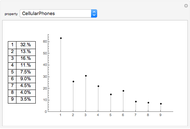 Country Data and Benford's Law
Jason Cawley -
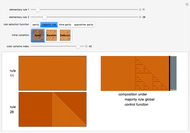 Cellular Automata with Global Control
Jason Cawley -
 Simulating the 2008 U.S. Presidential Election
Jason Cawley -
 Exploring Social Choice Theory
Jason Cawley -
 Fully Random, Five-Rule Interactive Cellular Automata (ICA)
Jason Cawley -
 Algorithmic Architecture with Cellular Automata
Jason Cawley -
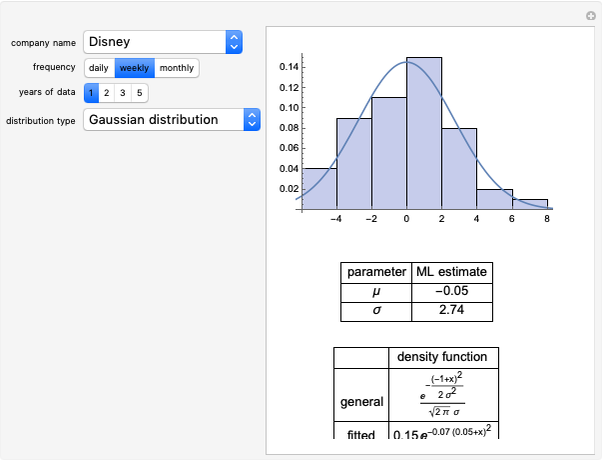 Modeling Return Distributions
Jason Cawley -
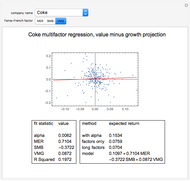 Expected Returns of the Dow Industrials, Fama-French Model
Jason Cawley -
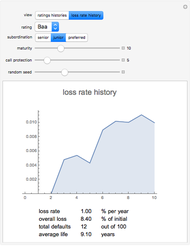 Credit Risk
Jason Cawley -
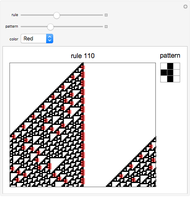 Highlighting Patterns in Cellular Automata
Jason Cawley -
 Markov Volatility Random Walks
Jason Cawley -
 Asset Allocation
Jason Cawley -
 Mean-Reverting Random Walks
Jason Cawley -
An Amoeba Problem
Jason Cawley -
 Totalistic K3 R 1/2 Cellular Automata
Jason Cawley -
 Cellular Automaton Model of Pine Savanna Dynamics in Response to Fire and Hurricanes
Jason Cawley