Goodness of Fit for Random Subsets


Requires a Wolfram Notebook System
Interact on desktop, mobile and cloud with the free Wolfram Player or other Wolfram Language products.
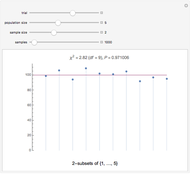
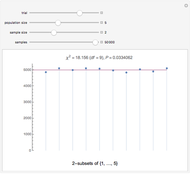
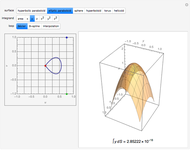
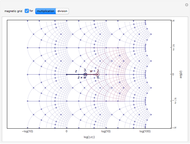
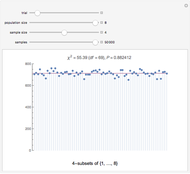
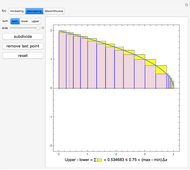
This Demonstration performs a  goodness-of-fit test on a set of random samples of a given sample size from a finite population. The count for each subset is indicated by a point; the expected value is indicated by the horizontal line. Tooltips on each show the values. The "trial" slider controls a seed for the random number generator, and gives a new set of samples for each value. The
  -value () is the probability that another set of truly random samples would be as far or farther away from the expected value (as measured by ).
Contributed by: Michael Rogers (Oxford College of Emory University) (March 2011)
Open content licensed under CC BY-NC-SA
Snapshots


Details
This Demonstration shows that the random sample function in Mathematica seems to choose each possible sample with (at least approximately) equal likelihood. The -value ranges over the interval [0,1]. This Demonstration does not show that the -values have a uniform distribution, but a user could keep track of the -values and plot his or her own distribution.
Permanent Citation
 Random Samples and Random Permutations
Ian McLeod Polynomial Fits of Random Walks
Michael Schreiber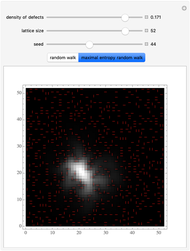 Generic Random Walk and Maximal Entropy Random Walk
Bartlomiej Waclaw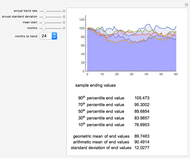 Mean-Reverting Random Walks
Jason Cawley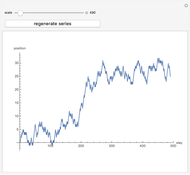 Self-Similarity in Random Walk
Hiroki Sayama A Reluctant Random Walk
Heikki Ruskeepää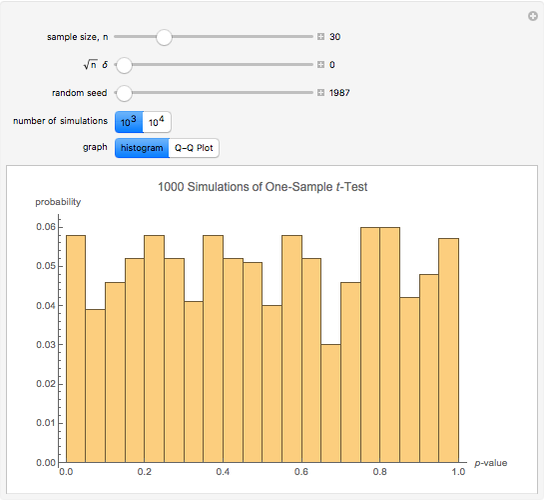 p-Values Are Random Variables
Ian McLeod (University of Western Ontario)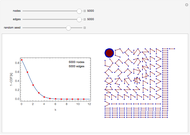 Degree Distribution on a Random Network
Jorge Villalobos Entropy of a Message Using Random Variables
Daniel de Souza Carvalho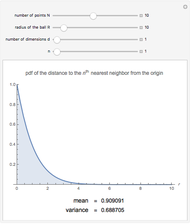 Distance Distributions in Finite Uniformly Random Point Processes
Sunil Srinivasa and Martin Haenggi
-
 Swirl and the Curl
Michael Rogers -
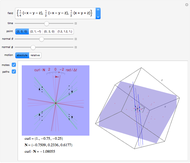
 Constructing Vector Geometry Solutions
Michael Rogers -
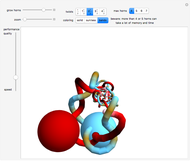 The Mating Dance of the Alexander Horned Spheres
Michael Rogers -
 Expansion and Divergence
Michael Rogers -
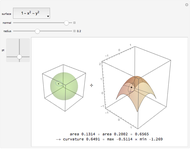
 Surface Integrals over Segments of Parametrized Surfaces
Michael Rogers -
 Surface Parametrizations and Their Jacobians
Michael Rogers -
 Composition and Transformations
Michael Rogers -
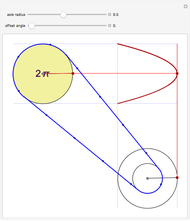
 Unwrapping Involutes
Michael Rogers -
 Aerial Tour of Differential Geometry
Michael Rogers -
 Exploring Surface Curvature and Differentials
Michael Rogers -
 Catacaustics for Some Graphs
Michael Rogers -
 Complex Slide Rule
Michael Rogers -
 Grow an Alexander Horned Sphere
Michael Rogers -
 Catacaustics Generated by a Point Source
Michael Rogers -
 The Geometry of Lagrange Multipliers
Michael Rogers -
 Goodness of Fit for Random Subsets
Michael Rogers -
 Newton's Integrability Proof
Michael Rogers -
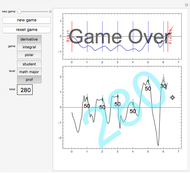 Calculus Slalom
Michael Rogers -
 Gauss Map and Curvature
Michael Rogers -
 Generating Lissajous Figures
Michael Rogers