Plots of Quantum Probability Density Functions in the Hydrogen Atom

Requires a Wolfram Notebook System
Interact on desktop, mobile and cloud with the free Wolfram Player or other Wolfram Language products.
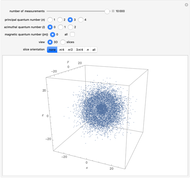
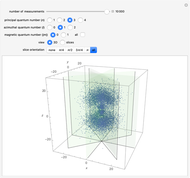
The main goal of this Demonstration is to plot 3D density clouds of the position of the electron in the hydrogen atom in states defined by the three quantum numbers  (principal),
  (azimuthal), and
  (magnetic). Each dot of the cloud represents a possible result of a measurement of the position of the electron in an individual atom. By imagining that the measurement is repeated many times in different atoms at the same quantum state, you can get a plot representing the probability density function associated with that state. A 2D view can also be obtained by a plane slice containing the
  axis. You can select the number of position measurements to be simulated, the quantum numbers , , and
  (or all values of combined in a single plot), and the type of view (3D or 2D). In the 2D slice view you can choose the slice orientation (four possibilities) or all four slices combined for better statistics. The length unit is set equal to the Bohr radius.
Contributed by: Carlos Rodríguez Fernández and Andrés Santos (April 2012)
Open content licensed under CC BY-NC-SA
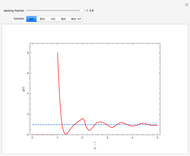
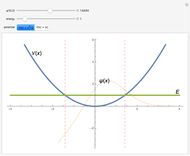
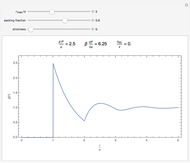
Snapshots


Details
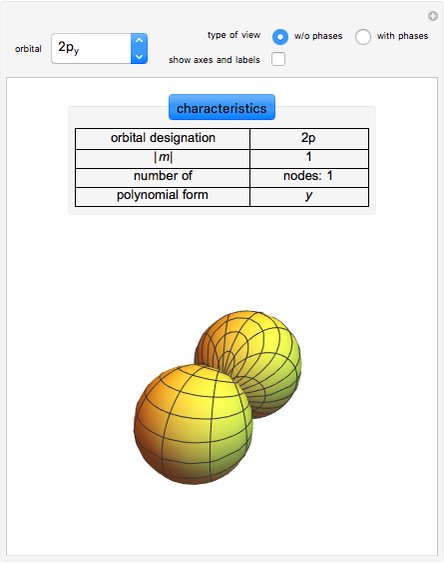
In spherical coordinates, the wavefunction associated with the quantum state (, , ) is  , where
  is a spherical harmonic and
  , where
  is a normalization constant and
  is a generalized Laguerre polynomial. The probability density function,
 , is independent of
  and of the sign of .
Reference
[1] R. Eisberg and R. Resnick, Quantum Physics of Atoms, Molecules, Solids, Nuclei, and Particles, New York: Wiley, 1985.
Permanent Citation
 Visualizing Atomic Orbitals
Guenther Gsaller Spherical Harmonics
Stephen Wolfram Wigner Function of a Canonical Ensemble of Harmonic Oscillators at a Given Temperature
Samira Bahrami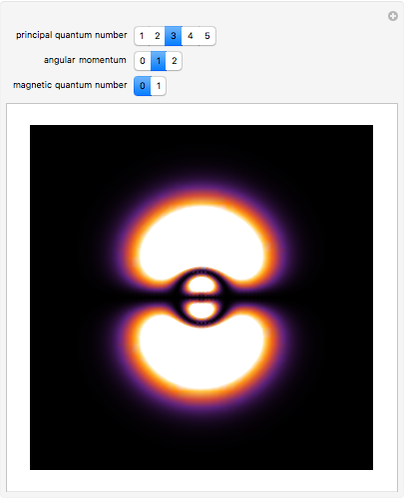 Hydrogen Orbital Densities
Enrique Zeleny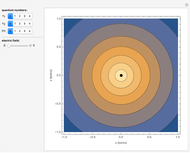 The Hydrogen Atom in Parabolic Coordinates
S. M. Blinder Spectral Series of the Hydrogen Atom
Enrique Zeleny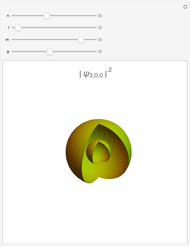 Hydrogen Orbitals
Michael Trott Hilbert Space Bases for Distinguishing Pure Quantum States in Low Dimensions
Wiljami Sillanpää Quantum Well Explorer
Richard Gass Causal Interpretation of the Quantum Harmonic Oscillator
Klaus von Bloh
-
 Radial Distribution Function for One-Dimensional Triangle Well and Ramp Fluids
Andrés Santos -
 Radial Distribution Function for Hard Spheres
Andrés Santos -
 Bound-State Solutions of the Schrödinger Equation by Numerical Integration
Andrés Santos -
 The Kac Ring Model
Andrés Santos -
 Radial Distribution Function for Sticky Hard Rods
Andrés Santos -
 Radial Distribution Functions for Nonadditive Hard-Rod Mixtures
Andrés Santos -
 Radial Distribution Function for One-Dimensional Square-Well and Square-Shoulder Fluids
Andrés Santos -
 Virial Coefficients for a Hard-Sphere Mixture
Andrés Santos -
 Inelastic Collisions of Two Rough Spheres
Andrés Santos -
 Plots of Quantum Probability Density Functions in the Hydrogen Atom
Andrés Santos -
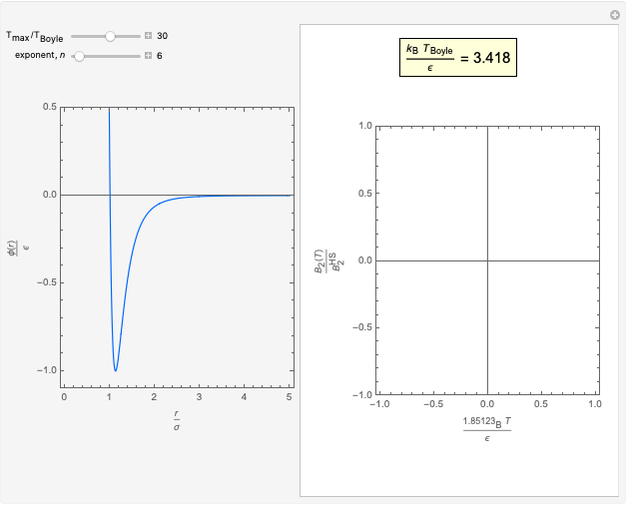 Second Virial Coefficients for the Lennard-Jones (2n-n) Potential
Andrés Santos -
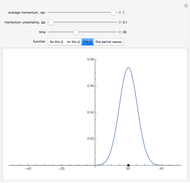
 Wave Packets for Particle in a Box
Andrés Santos -
 Classical Scattering with a Penetrable Square-Well Potential
Andrés Santos -
 Wavepacket for a Free Particle
Andrés Santos -
 Inelastic Collisions of Two Spheres
Andrés Santos