Residue Curve Map for Methyl Acetate and Isopropyl Acetate Chemistry at 1 atm

Requires a Wolfram Notebook System
Interact on desktop, mobile and cloud with the free Wolfram Player or other Wolfram Language products.
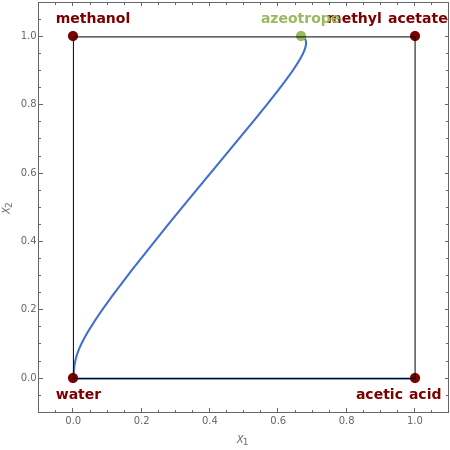
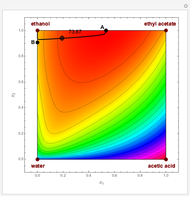
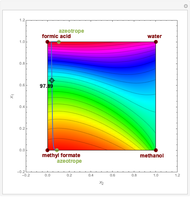
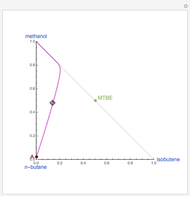
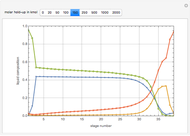
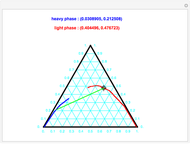
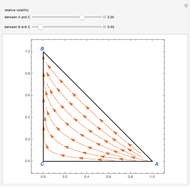
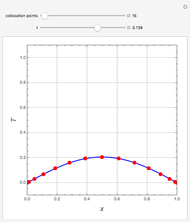
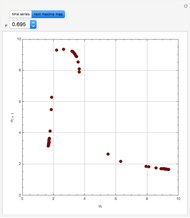
This Demonstration plots the residue curve passing through the locator position.
[more]
Contributed by: Housam Binous (March 2011)
Open content licensed under CC BY-NC-SA
Snapshots
Details
For decades, reactors were followed by separation units such as distillation columns in order to recycle reactants and to separate products. Reactive distillation, which combines both operations in one piece of equipment, presents many advantages: increased selectivity, lower capital investment and operating cost, higher conversion in the case of equilibrium-limited reactions (such as esterification reactions considered in the present Demonstration), decreased risks of thermal runaway, separation of close-boiling compounds and reduction of environmental emissions, and so on.
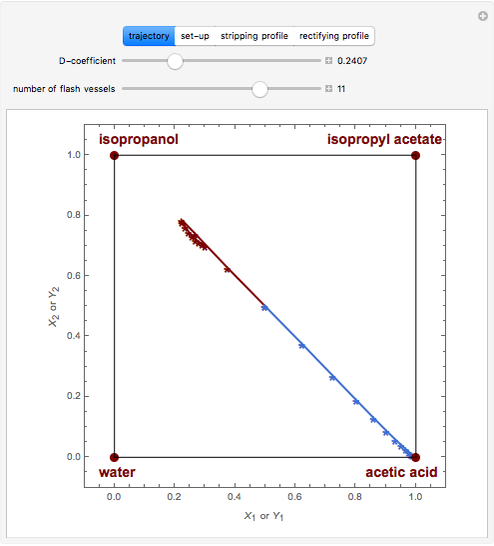
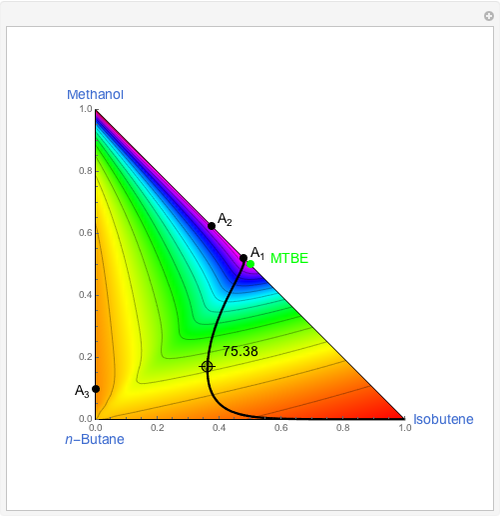
The computation and analysis of residue curve maps is an important tool in the conceptual design of reactive distillation columns.
The governing equation is the following differential-algebraic system:
 , where
  is a warped time,
  and
and  , where
  is the index of the reference component and
  is the total number of components.
 and
and  are the liquid and vapor transformed compositions (Barbosa and Doherty, 1988) given by
 and
and  ,
,  and
and  , where
  and
and  are the liquid and vapor mole fractions of component
  ,
,  is the index of the reference component,
  is the stoichiometric coefficient of component
  , and
, and  for the two esterification reactions between methanol and acetic acid as well as between isopropanol and acetic acid.
The computation takes into account the deviation from ideal behavior in the liquid phase by using the Wilson model for the methyl acetate chemistry and the NRTL model for the isopropyl acetate chemistry as well as acetic acid dimerization in the gas phase by using Marek's method (1954 and 1955).
For more information, see
M. F. Doherty, M. F. Malone, Conceptual Design of Distillation Systems, New York: McGraw-Hill, 2001.
H. Binous, "Residue Curve Map for Homogeneous Reactive Quaternary Mixtures," Computer Applications in Engineering Education, 15(1), 2007 pp. 73–77.
Permanent Citation
