Three-Asset Efficient Frontier


Requires a Wolfram Notebook System
Interact on desktop, mobile and cloud with the free Wolfram Player or other Wolfram Language products.
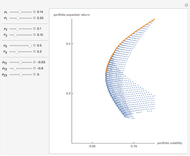
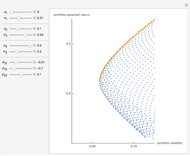
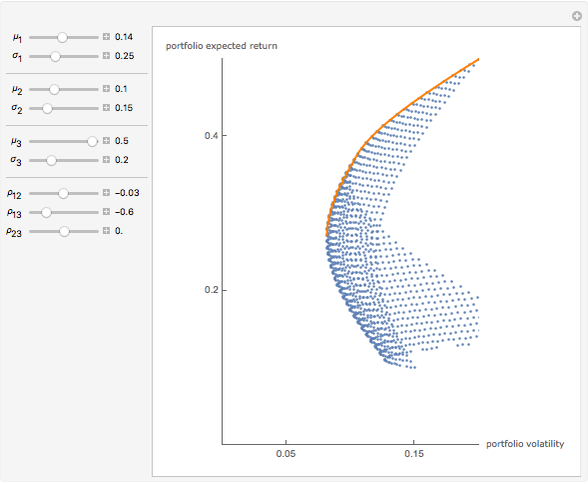
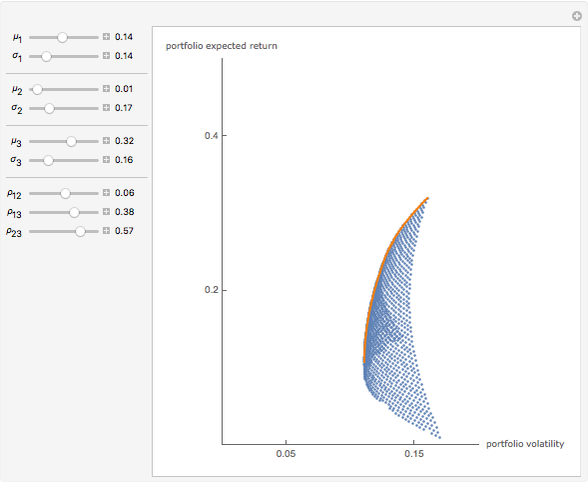
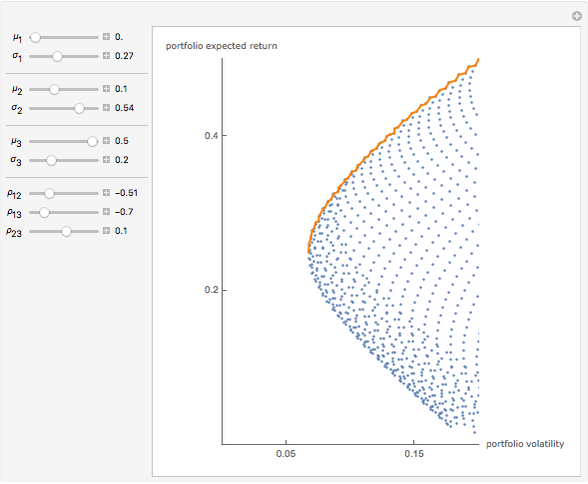
Consider three assets with expected returns  and standard deviations of returns
  ; i = 1, 2, 3. Let the correlation coefficient between asset i and asset j be
  . Each blue point represents the expected return and the standard deviation of return of a portfolio created by a specific combination of the three assets. The orange line, known as the efficient frontier, sketches out the portfolio combinations such that for any expected return, the volatility (or standard deviation of return) is the lowest; and for any level of volatility, the expected return is the highest.
Contributed by: Fiona Maclachlan (March 2011)
Open content licensed under CC BY-NC-SA
Snapshots

Details
detailSectionParagraphPermanent Citation
"Three-Asset Efficient Frontier"
http://demonstrations.wolfram.com/ThreeAssetEfficientFrontier/
Wolfram Demonstrations Project
Published: March 7 2011
 Two-Asset Markowitz Feasible Set
Jim R Larkin Efficient Single Limit Liability Insurance
Seth J. Chandler The Efficient Dual-Limit Liability Insurance Contract
Seth J. Chandler Constant Risk Aversion Utility Functions
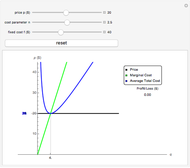
Seth J. Chandler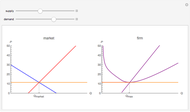 Profit Maximization in Perfect Competition
Fiona Maclachlan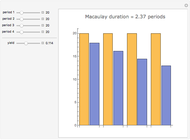 Macaulay Duration
Fiona Maclachlan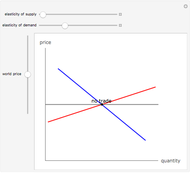 Gains from Trade
Fiona Maclachlan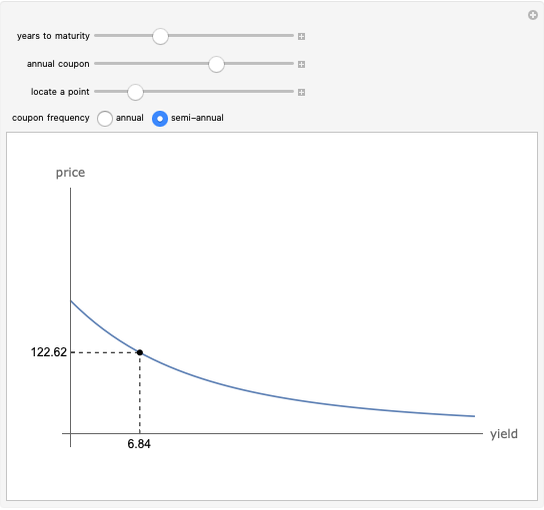 Price-Yield Curve
Fiona Maclachlan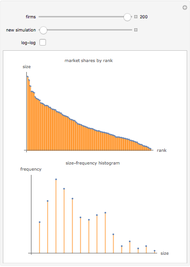 A Model of Market Shares II
Fiona Maclachlan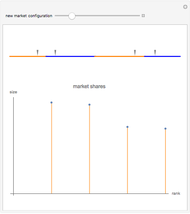 A Model of Market Shares I
Fiona Maclachlan
-
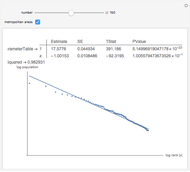 Zipf's Law for U.S. Cities
Fiona Maclachlan -
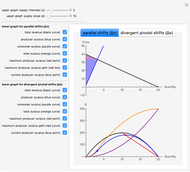 How Continuous Innovation Affects Supply, Producer Surplus, and Consumer Surplus
Fiona Maclachlan -
 Monopoly Model
Fiona Maclachlan -
 Competitive Model
Fiona Maclachlan -
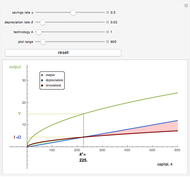 Simple Solow Model
Fiona Maclachlan -
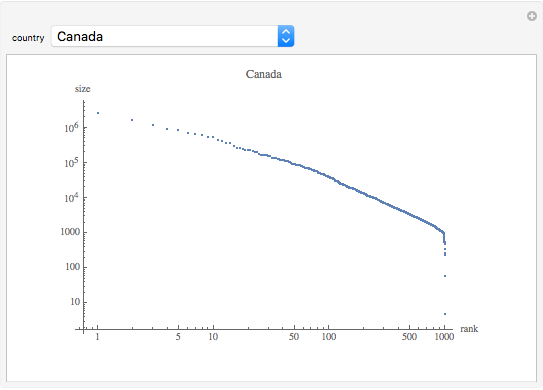 Zipf's Law for Cities
Fiona Maclachlan -
 Money Supply Process
Fiona Maclachlan -
A Model of Market Shares I
Fiona Maclachlan -
Macaulay Duration
Fiona Maclachlan -
Gains from Trade
Fiona Maclachlan -
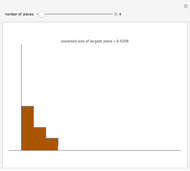 Broken Stick Rule
Fiona Maclachlan -
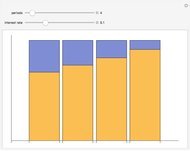 Amortized Loan Interest and Principal
Fiona Maclachlan -
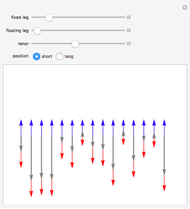 Interest Rate Swap
Fiona Maclachlan -
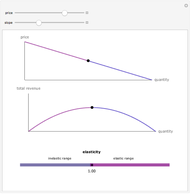 Elasticity, Total Revenue, and the Linear Demand Curve
Fiona Maclachlan -
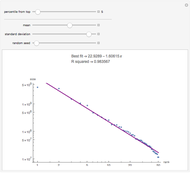 Power Law Tails in Log Normal Data
Fiona Maclachlan -
 Concentric Circles
Fiona Maclachlan -
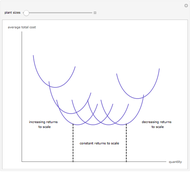 Long-Run Average Total Cost
Fiona Maclachlan -
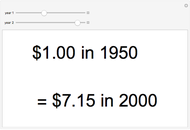 Purchasing Power Calculator
Fiona Maclachlan -
 Three-Asset Efficient Frontier
Fiona Maclachlan -
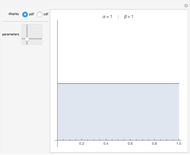 Beta Distribution
Fiona Maclachlan